

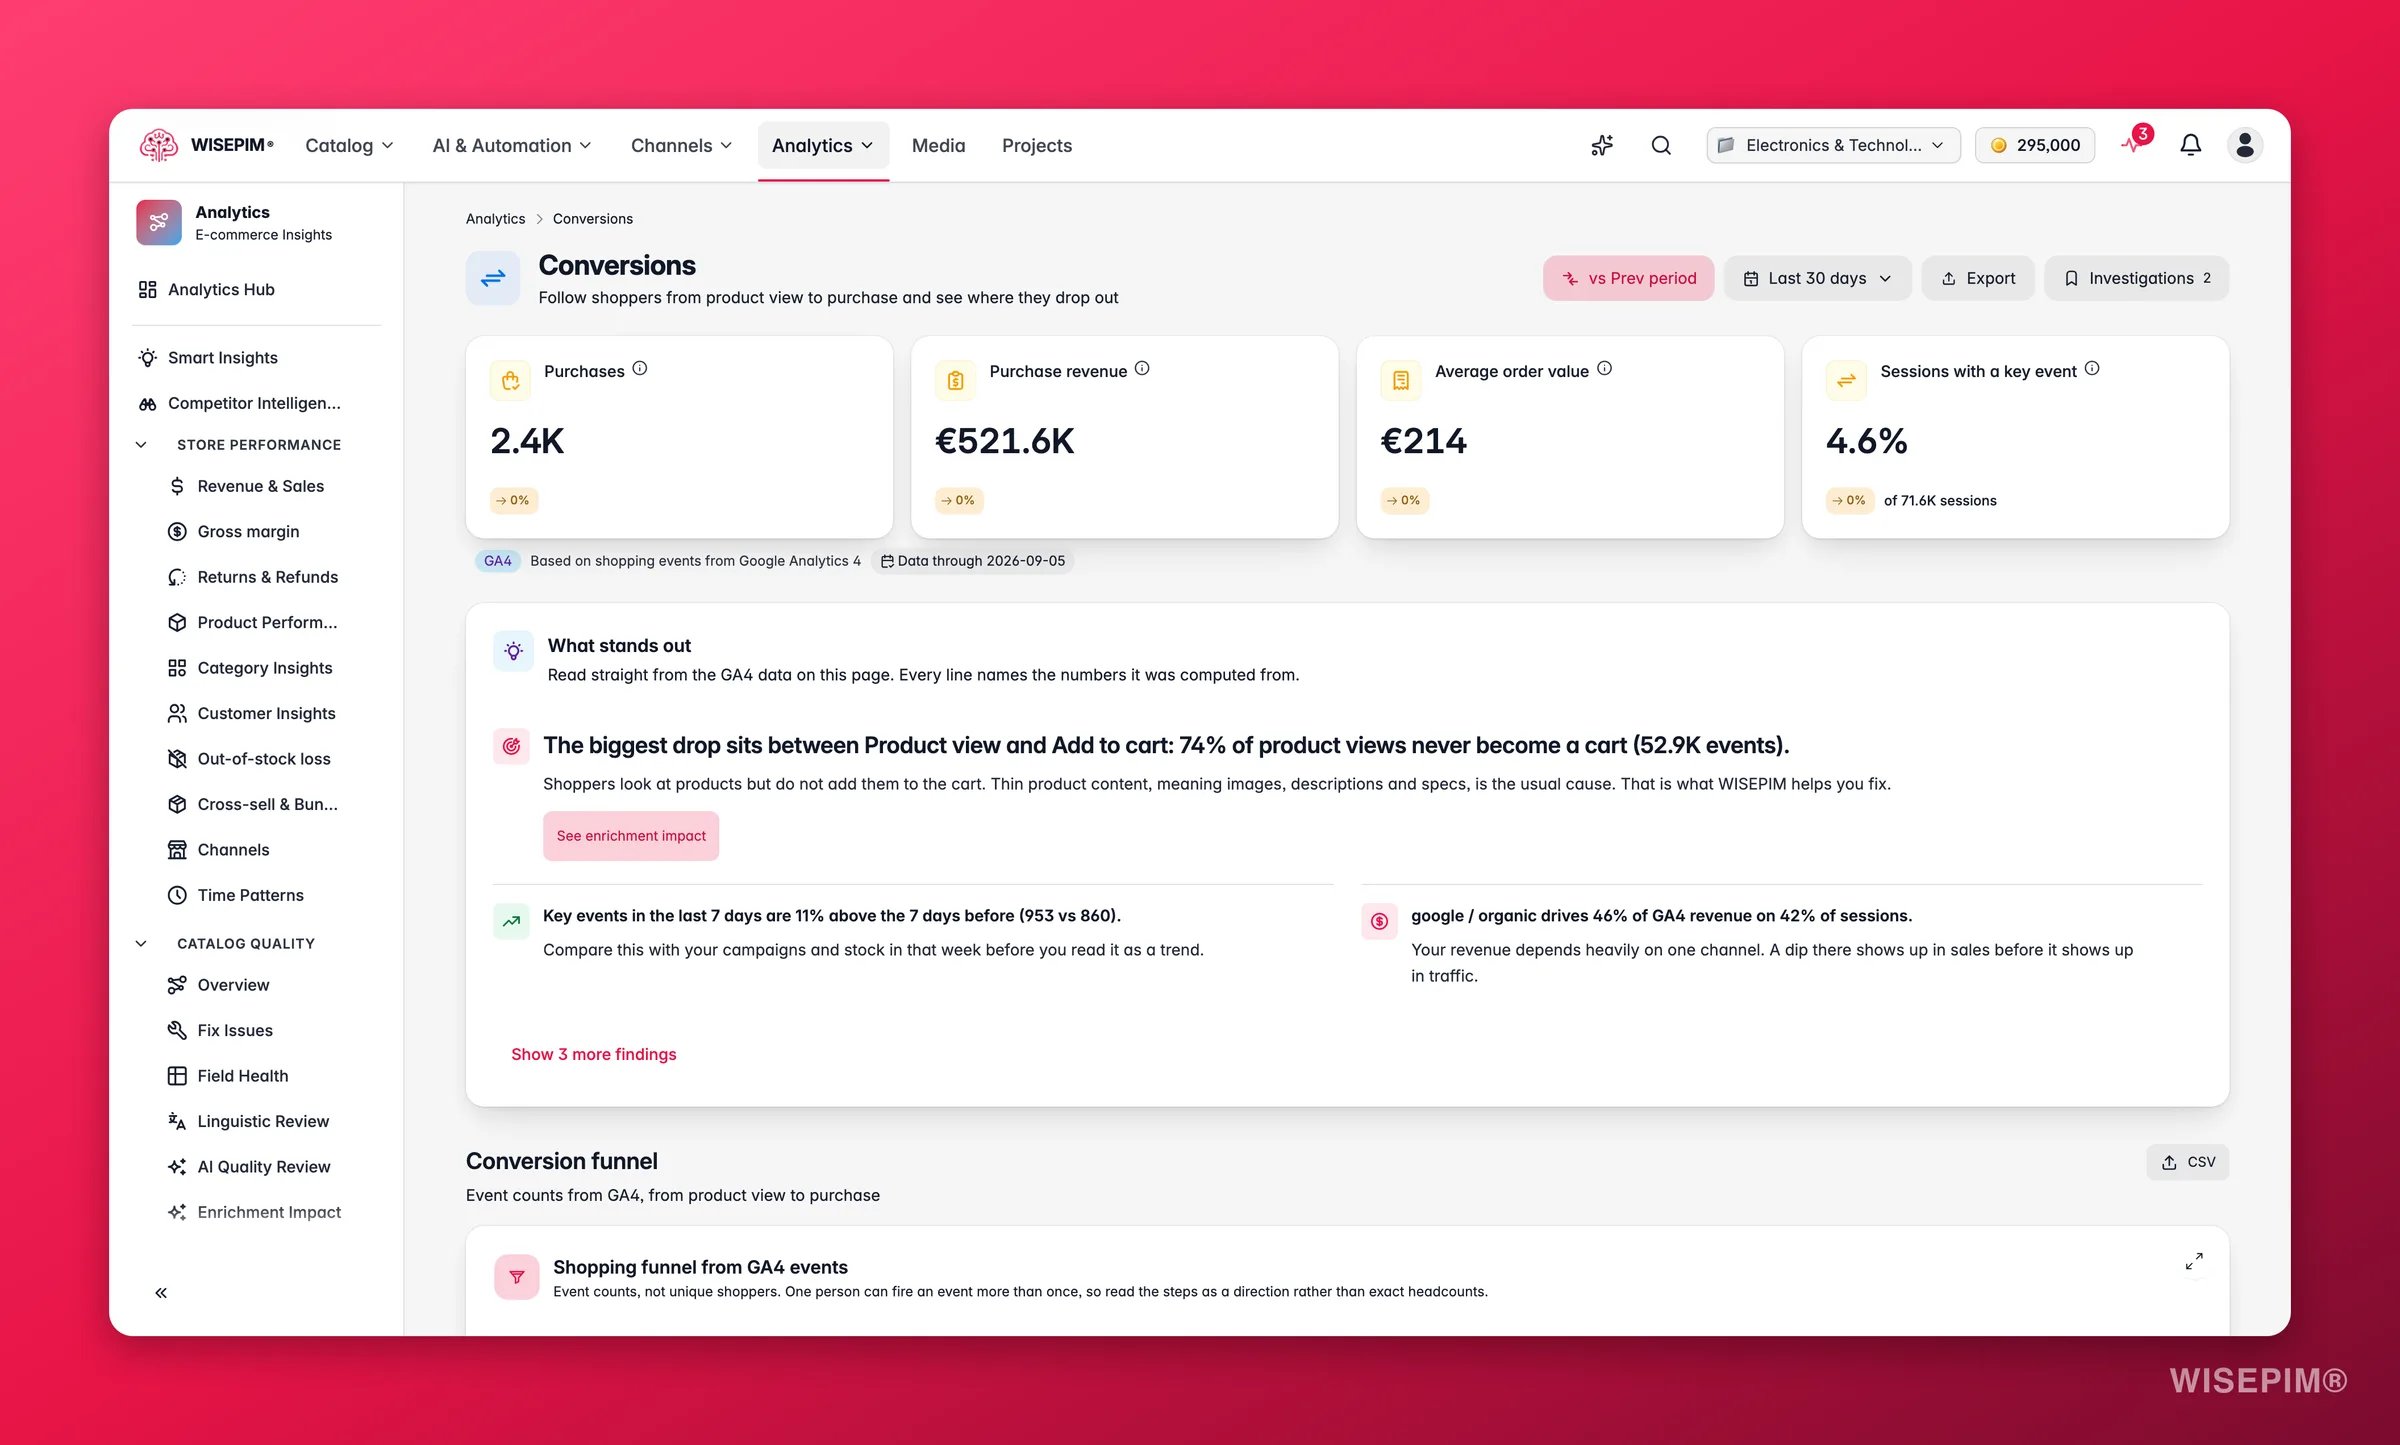
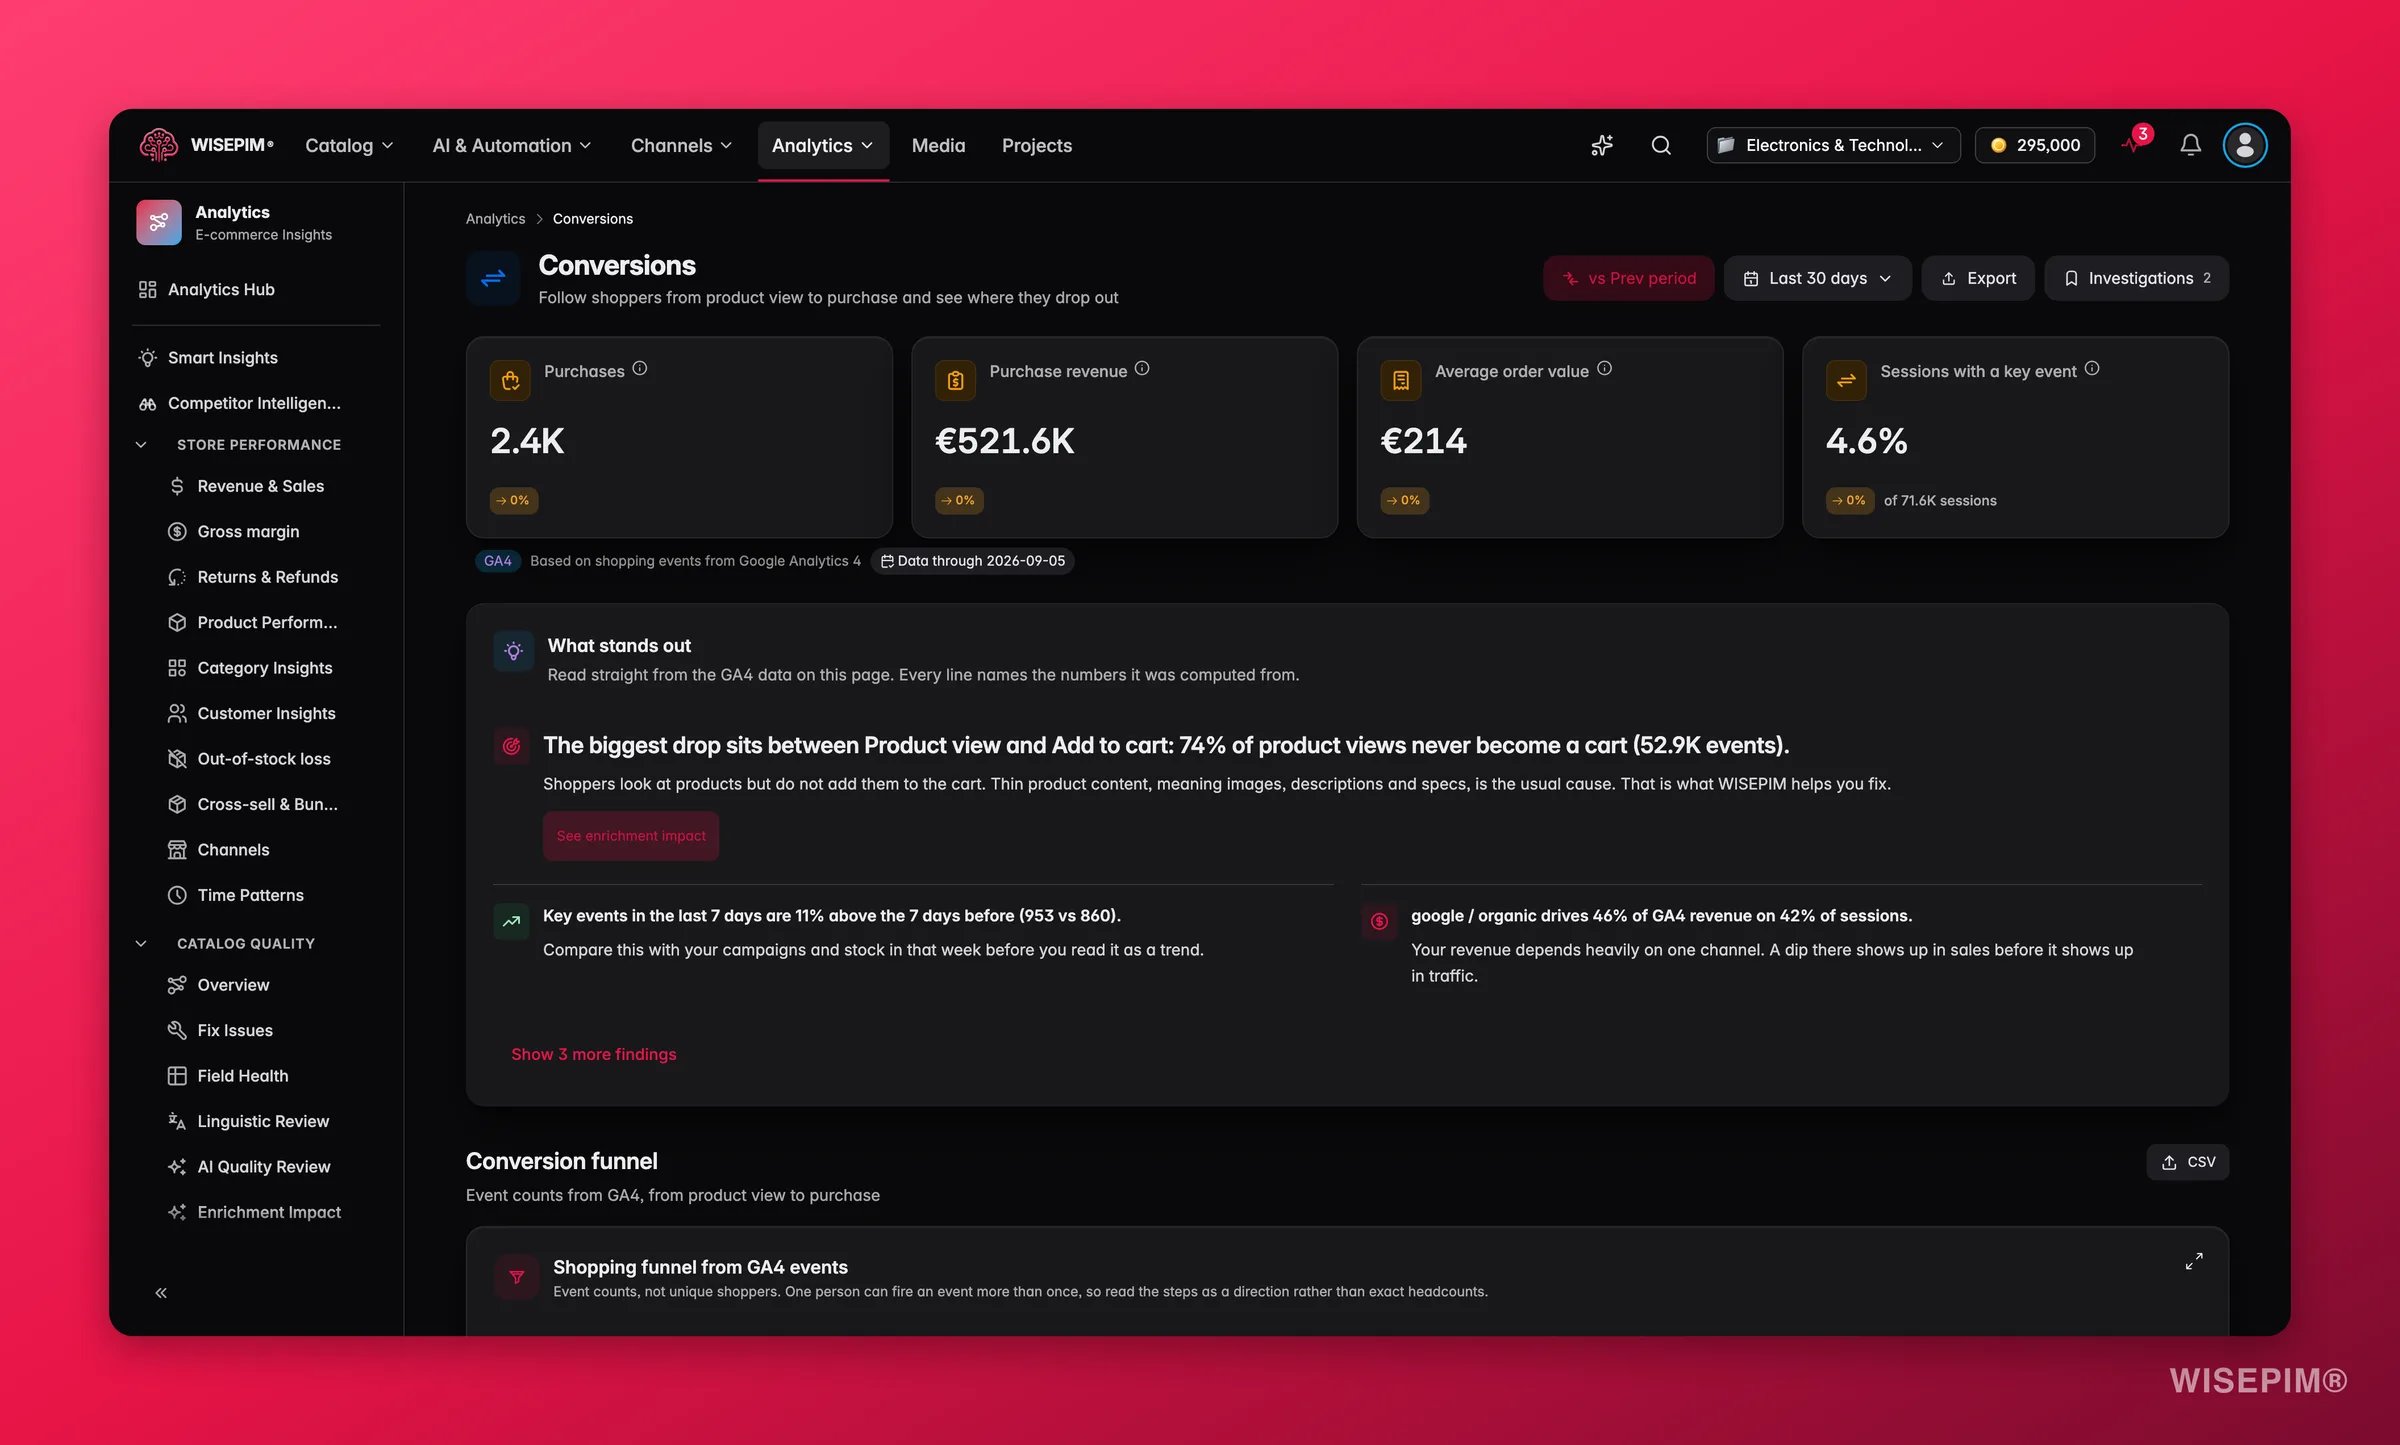
The order-based funnel needs session and checkout data from a connected commerce platform. The behavioral funnel needs a connected Google Analytics 4 property with standard ecommerce events. WISEPIM shows either source independently when the other is unavailable.
Metrics at a glance
These four numbers tell you how well your store turns traffic into sales.Conversion-rate benchmark scale
Your current conversion rate is plotted on a four-band scale so you can see at a glance where you stand and how far you are from the next tier.
The same benchmark chip appears under the cart-abandonment and checkout-abandonment KPIs so you can benchmark each stage independently.
Checkout health
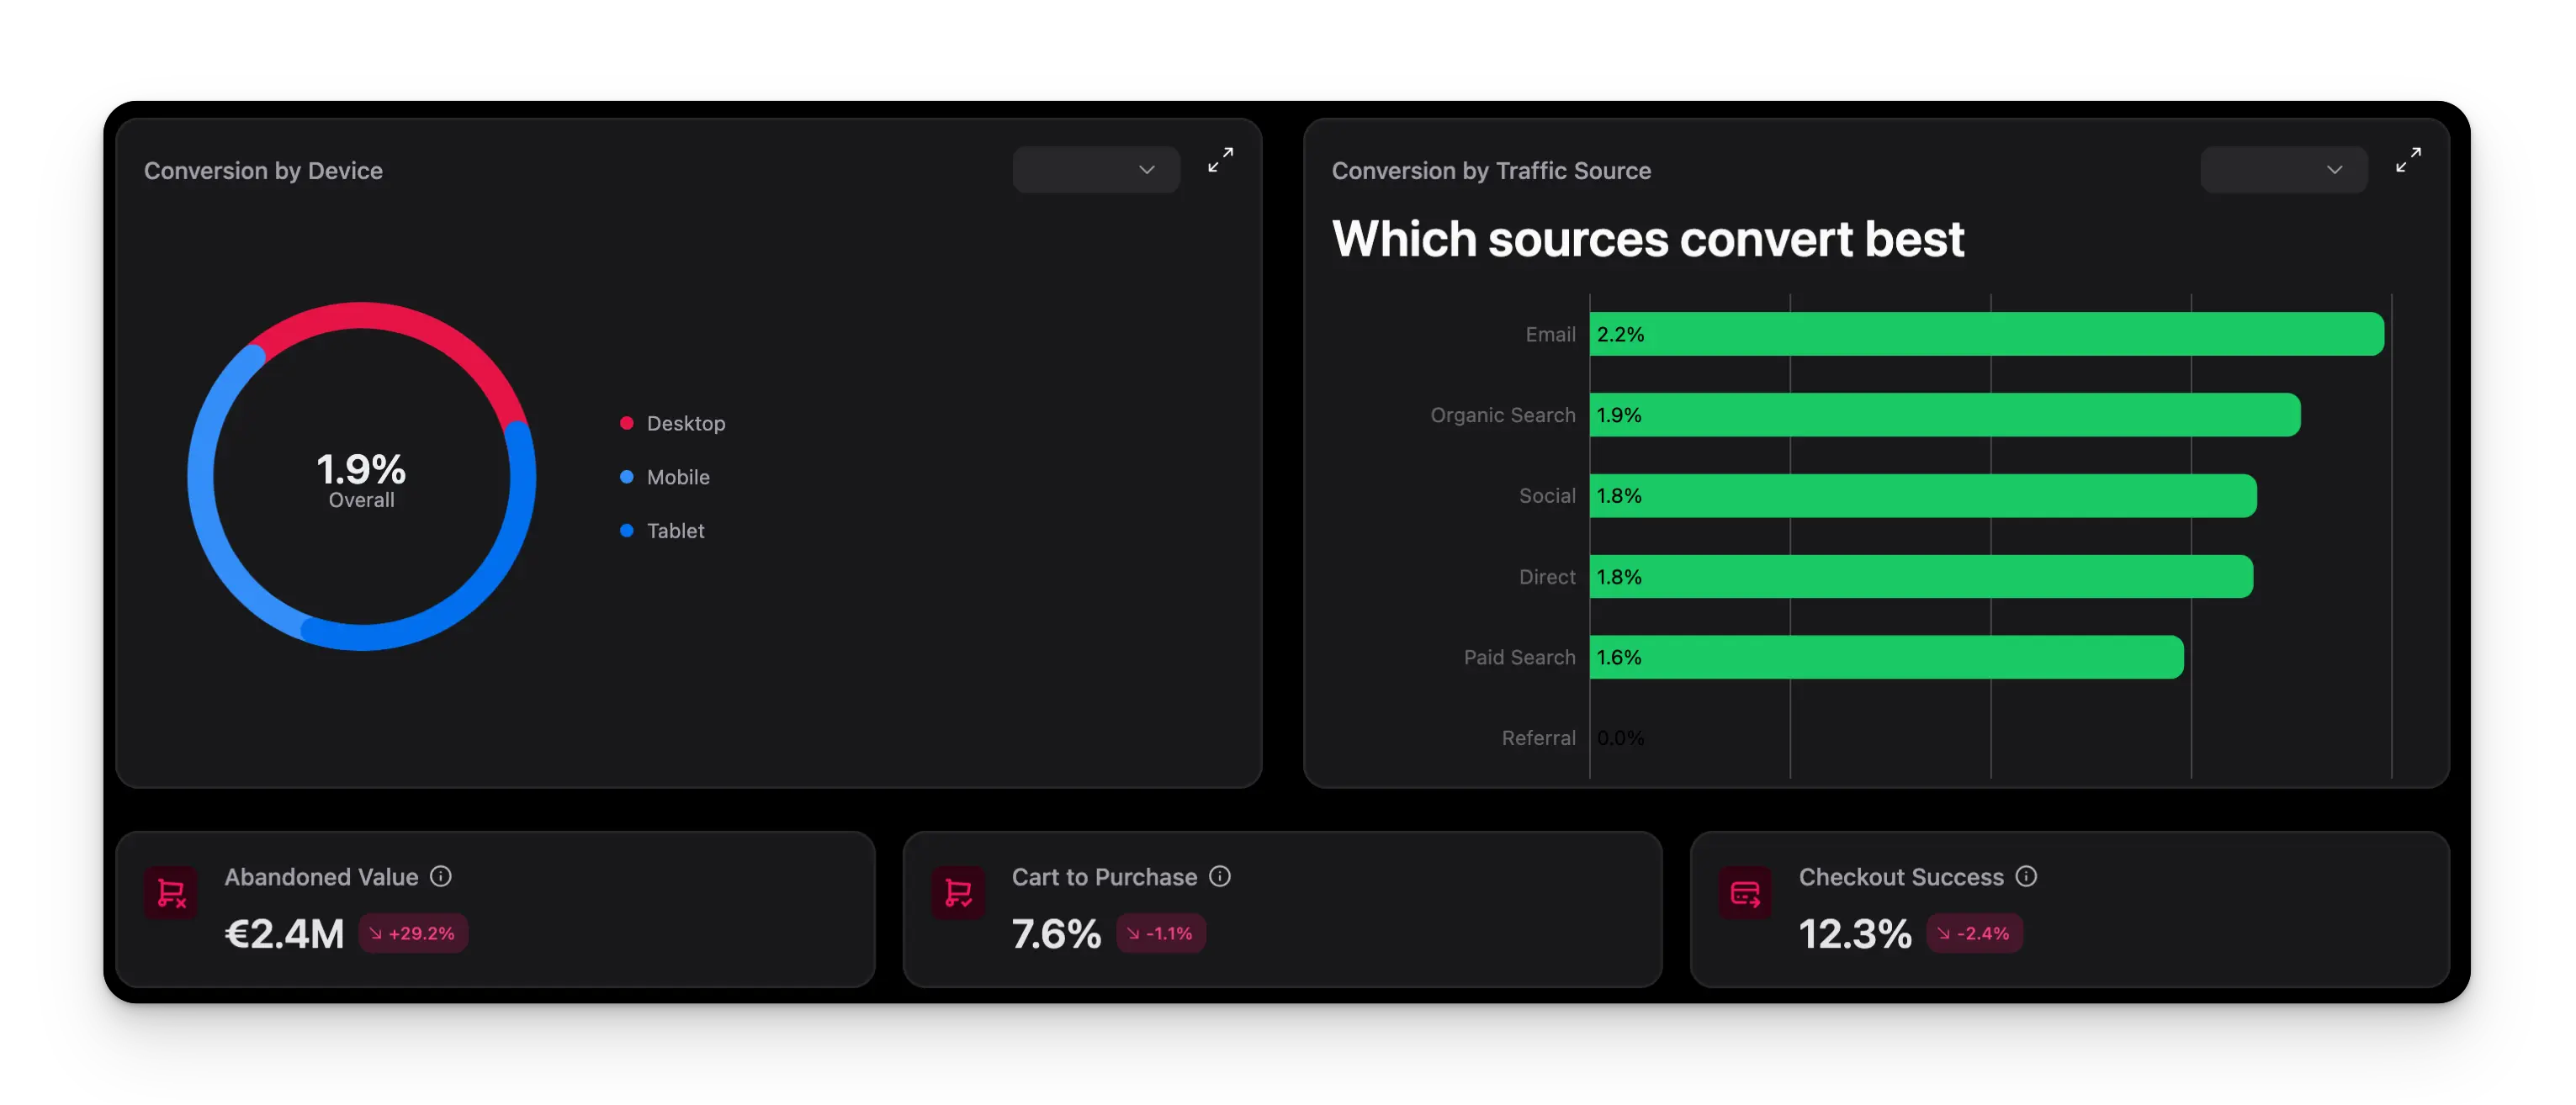
A dedicated row surfaces the health of your checkout process in three numbers:- Abandoned cart value: total revenue sitting in abandoned carts during the period. Recovering even a fraction has a direct bottom-line impact.
- Cart-to-purchase rate: how many carts actually turn into completed orders.
- Checkout success rate: how many started checkouts reach payment confirmation.
The order-based funnel
The funnel shows each stage in sequence: sessions → product views → add to cart → checkout started → purchase completed. Each stage lists its count and the percentage drop-off to the next. The largest single drop is where you lose the most shoppers, start your optimisation there. Below the funnel, three insight chips surface the most actionable signals automatically:- Biggest drop-off stage: the step with the steepest fall, so you know where to look first.
- Biggest lever: the stage where the most sessions are lost in absolute terms. Fixing this delivers the largest raw recovery.
- Cart-to-purchase rate: a direct read on how effectively your checkout converts carts into orders.
Google Analytics 4 ecommerce events
The GA4 event view requires a connected Google Analytics 4 property. After connecting or changing a property, wait for the background sync to complete before expecting the funnel to populate.
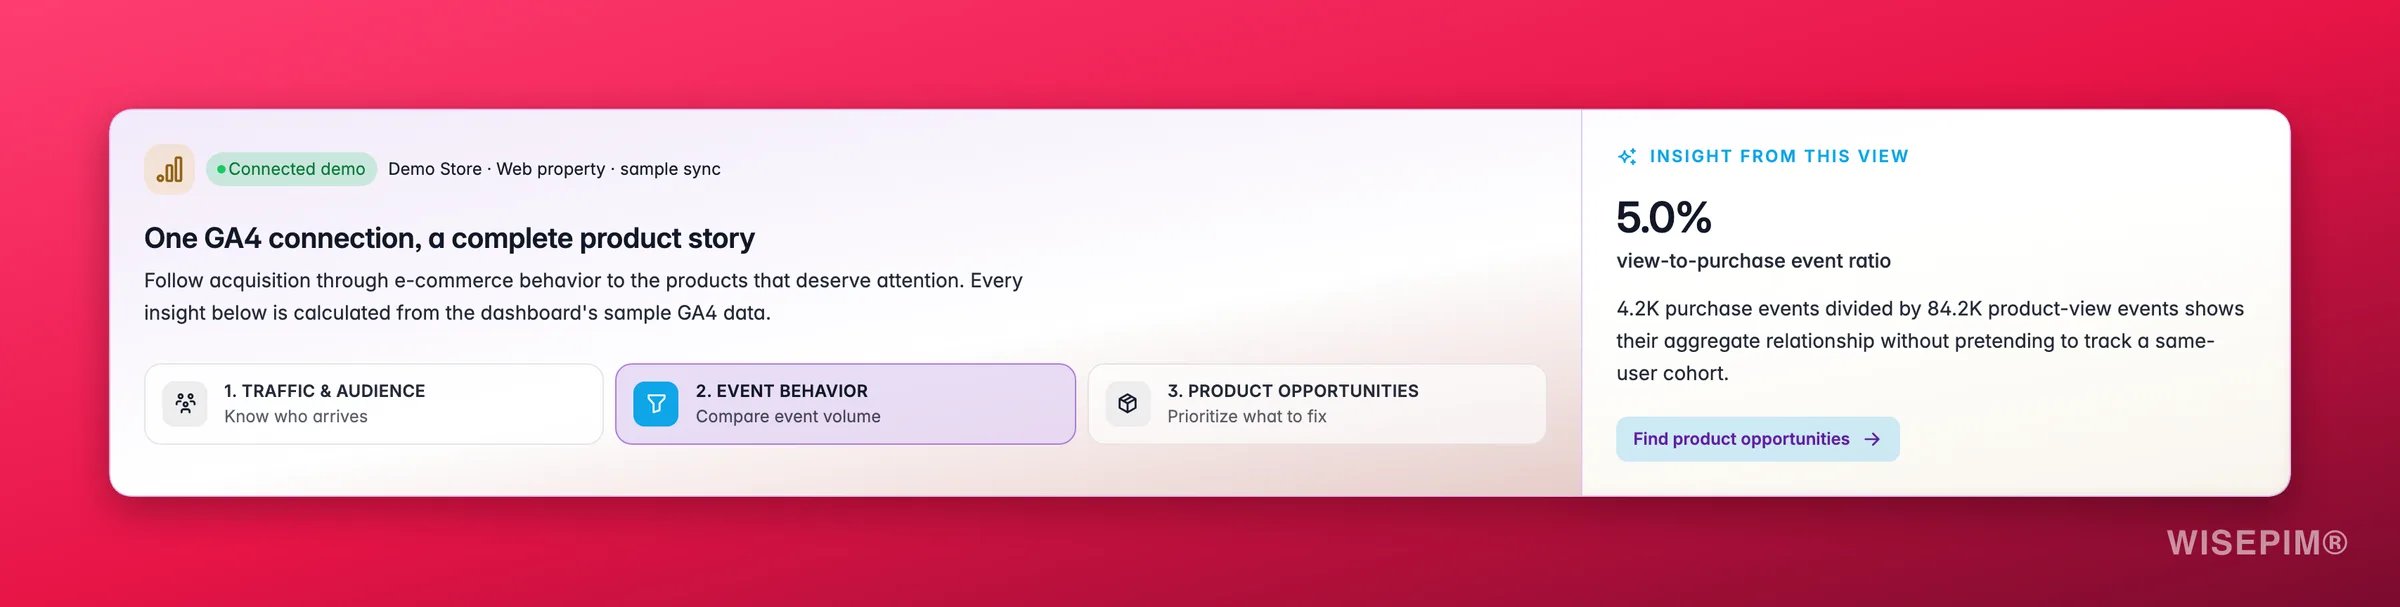
Below the counts, GA4 event ratios divide one event total by another. They are directional ratios between independent event counts, not user conversion or cart-abandonment rates:
Because the counts are event-driven, they expose earlier, harder-to-observe stages than completed orders alone. Use them as directional evidence, then investigate the affected product pages or checkout flow. When GA4 is connected but no shopping events came in for the period, the section says GA4 funnel not ready yet and points you to check the property’s events or start a sync.
Act on what you find
Add-to-cart rate is low (under 5%)
Add-to-cart rate is low (under 5%)
Visitors are not convinced to act. The most common cause is weak product content: thin descriptions, few or poor images, and unclear pricing. Open Data Quality to find the products with the lowest quality scores, then run AI enrichment to fill the gaps. Cross-reference with Search & Discovery to confirm these products are surfacing in relevant searches. Outcome: more visitors taking the first step into your purchase funnel, which lifts every downstream metric.
Cart abandonment is above 70%
Cart abandonment is above 70%
Shoppers added items but left before checkout. The top killers are surprise shipping costs, missing payment methods, and checkout friction. Review your checkout configuration on the relevant platform. In parallel, check Product Performance to see if the abandoned products have pricing issues, if your average selling price is out of line with the category, that also drives abandonment. Outcome: recovery of revenue that was already signalled by a cart add, with no extra traffic spend.
GA4 shows a large drop between begin_checkout and purchase
GA4 shows a large drop between begin_checkout and purchase
Intent was established, the shopper entered checkout but did not finish. The problem almost always lies in the checkout flow itself: payment errors, required account creation, unexpected fees, or a slow/broken payment step. This is a platform-level fix, but you can validate which products or price points are most affected by checking the Revenue & Sales top products table for patterns. Outcome: closed checkout-stage leakage on shoppers who had already committed to buy.
High traffic but low overall conversion rate (under 1.5%)
High traffic but low overall conversion rate (under 1.5%)
If sessions are high but conversion rate is in the Poor band, the problem is systemic. Check the funnel to see where the largest single drop-off sits: if it is sessions → product views, your landing pages are not connecting visitors to relevant products (see Search & Discovery). If it is product views → add-to-cart, content quality is the lever, use AI enrichment on your highest-traffic, lowest-converting products. Outcome: improvement in conversion rate from the same traffic, compounding into a significant revenue lift.
Checkout success rate is healthy but overall conversion is still low
Checkout success rate is healthy but overall conversion is still low
If shoppers who start checkout almost always complete it, but your headline conversion rate is still low, the leakage is happening before checkout, at the product page or cart stage. Focus enrichment effort on AI enrichment and review product pricing with Bulk Edit → Change price on products with high view counts but low add-to-cart. Outcome: targeted work on the funnel stages that actually need it, rather than a blanket audit.
Compare against benchmarks
Conversion benchmarks by metric
Conversion benchmarks by metric
Benchmarks shift a lot by industry and price point. Treat them as direction, not hard targets. Compare against your own history first.
Related
Traffic & Behavior
See where your visitors come from and how they behave on your site.
Revenue & Sales
See how conversion gains turn into revenue growth.
Search & Discovery
See how customers find products and clear the path to purchase.