Smart Insights needs order history to detect changes, plus your product catalog and data-quality scores to connect a drop in sales to a root cause. The more you have connected (returns, channels, Search Console), the richer the insights.
What you see
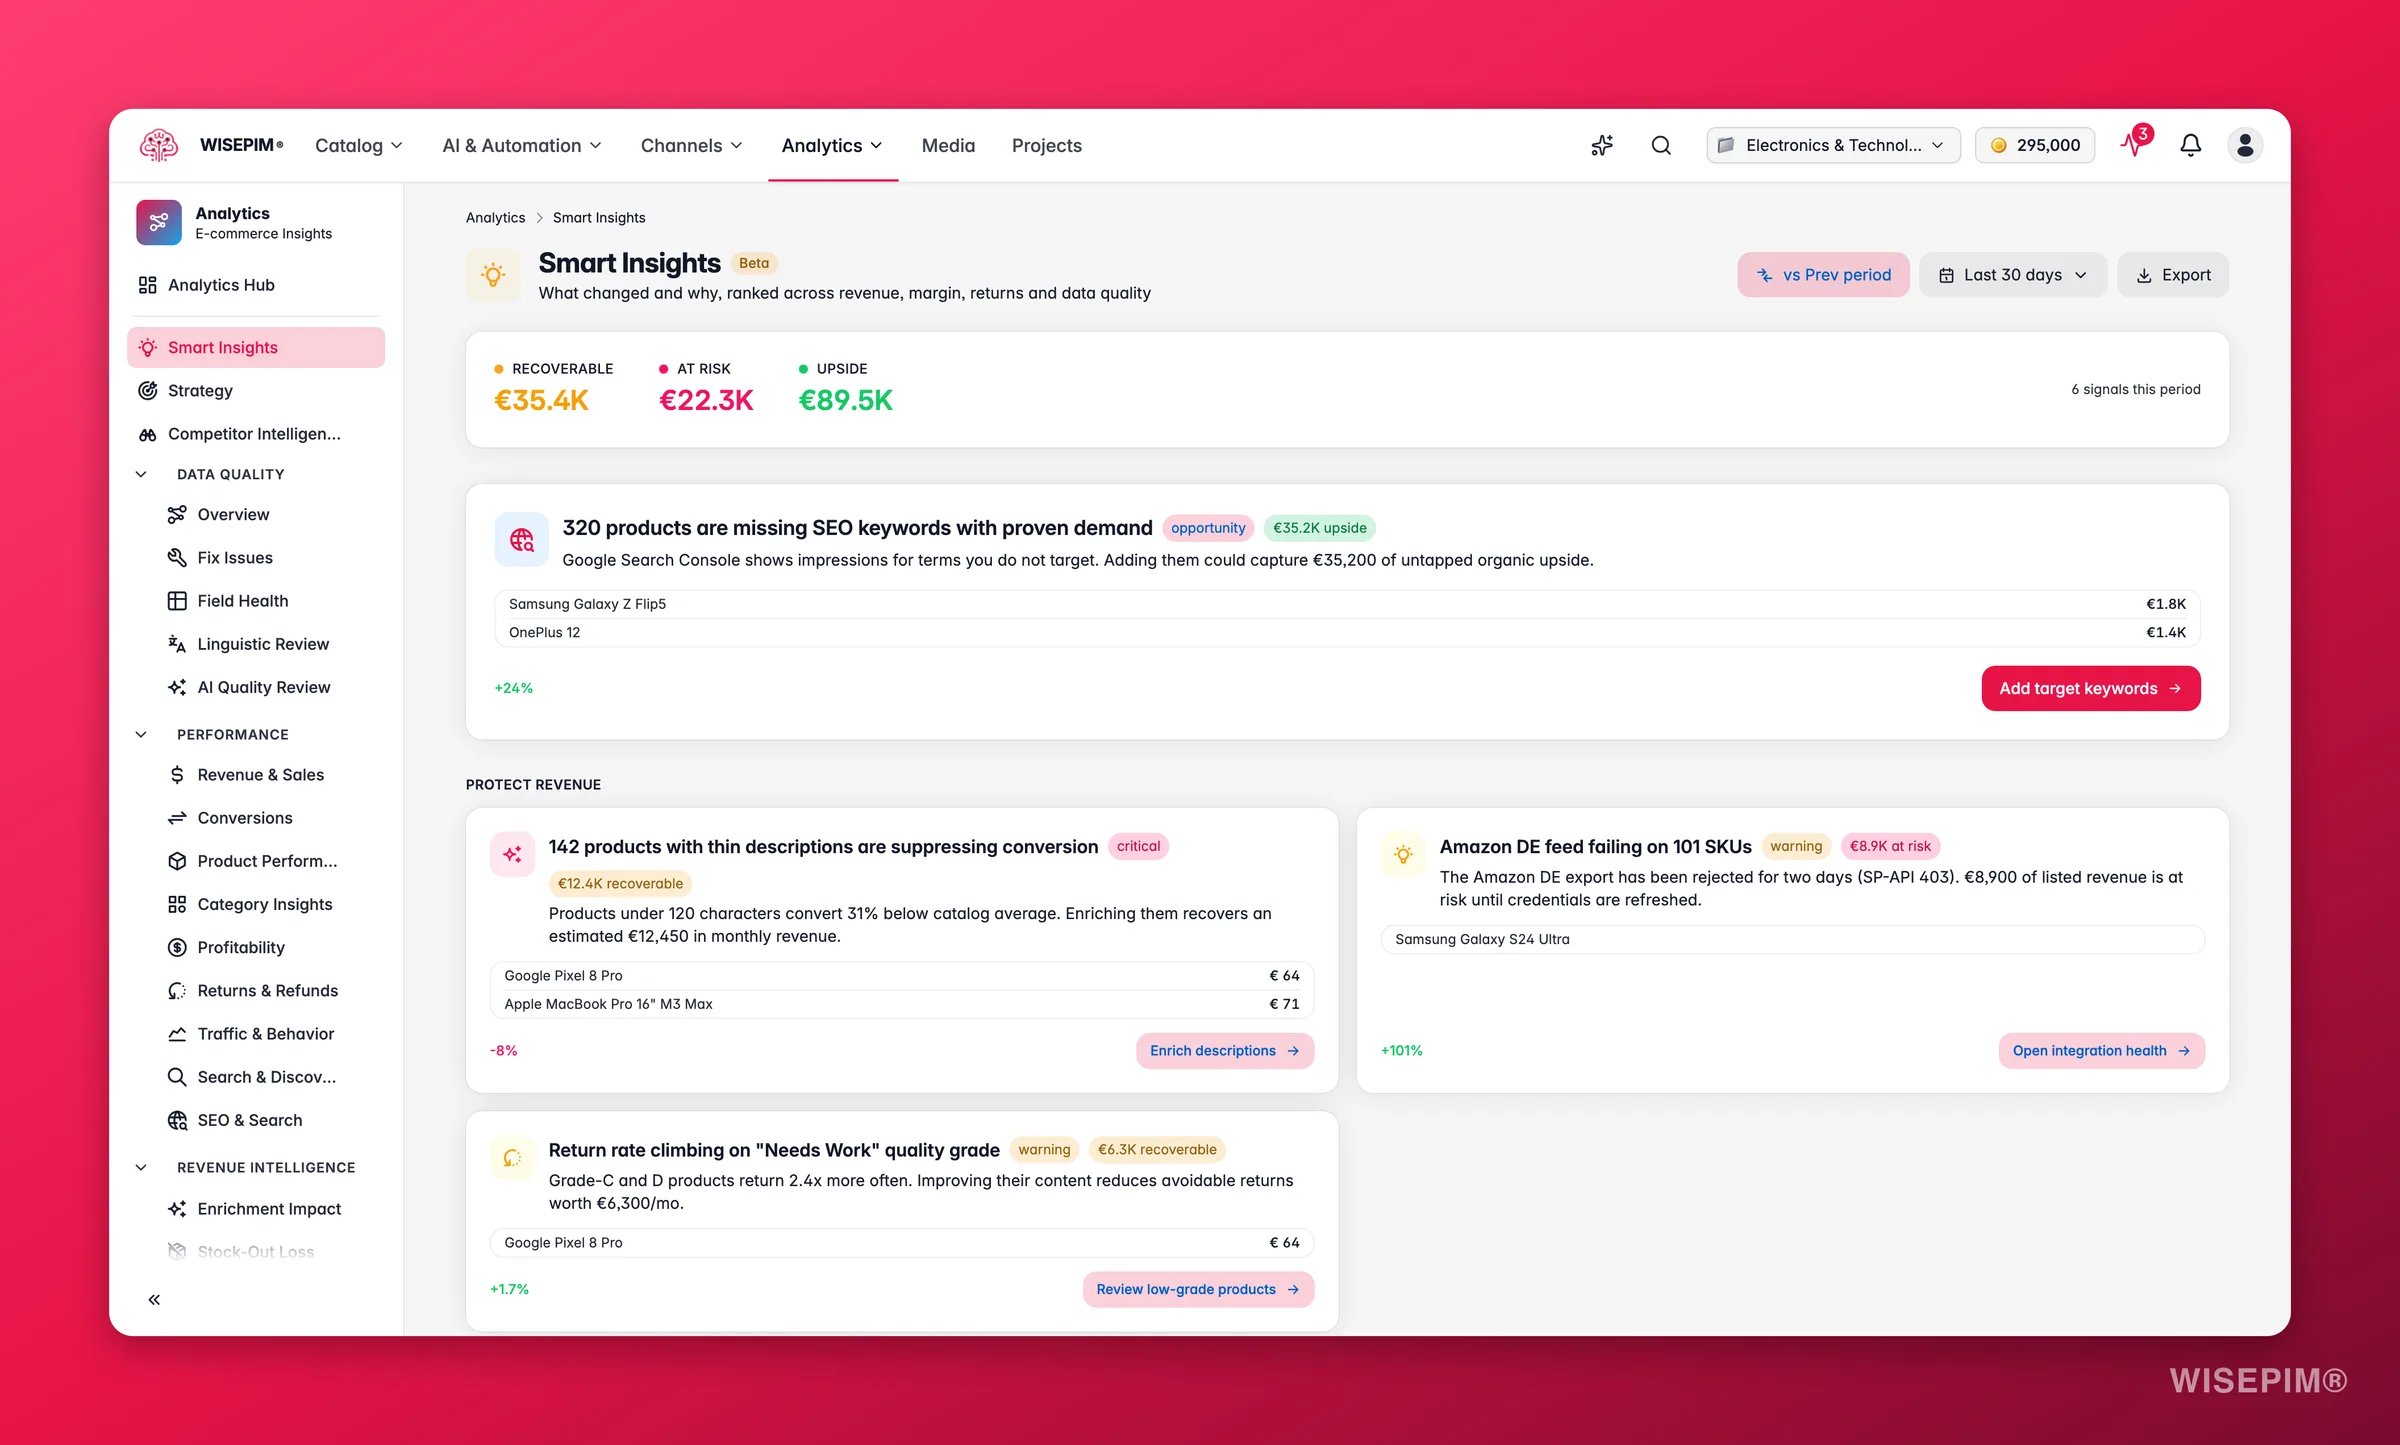
Below the rollup, the top-ranked insight is promoted to a featured hero card with its full contributor list. The remaining insights are grouped into Protect revenue and Capture upside sections so you can pick your priority, fix what is breaking or pursue what is growing.
Each insight card shows:
- The root cause in plain language, not just the symptom.
- A quantified impact (currency amount, percent change, or count) so you know what is at stake.
- The top contributing products, categories, or segments so you know where to look.
- A one-click action that opens the exact filtered product view, enrichment run, or report behind the signal.
Reading the signals
- Multiple “at risk” signals in the same period often point to a single upstream cause, a stalled integration, a botched bulk import, or a seasonal shift. Check whether the affected products or channels overlap before acting on each signal separately.
- A large “recoverable” total with few affected SKUs is a high-priority situation: a small fix on a handful of high-revenue products produces an outsized return. Act on this first.
- “Upside” signals with a lapsing-customer or low-ranking-keyword cause respond well to automation, consider wiring the action to an Automation rather than doing it manually each time.
How to use it
1
Start at the top
Insights are ranked by impact. The first card is where your attention pays off most.
2
Read the why
Each insight explains the cause, not just the symptom, and lists the products or categories involved.
3
Take the action
Every card links straight to the fix: an enrichment run, a bulk edit, a filtered product view, or the detailed report behind the signal.
Act on what you find
'Recoverable' total is significant
'Recoverable' total is significant
Open the top recoverable insight and click its action link. Most recoverable signals resolve to a product enrichment (missing images, inaccurate descriptions causing returns) or a sync fix. Outcome: stopping a revenue leak immediately, even before you optimize for growth.
Returns spike detected on specific products
Returns spike detected on specific products
The insight will list the top-returning SKUs. Use the action link to open those products and check their description accuracy and image set. Correcting content mismatch between the listing and the physical product reduces “not as described” returns. Go to Returns & Refunds to track the rate after the fix. Outcome: lower return rate directly improves margin.
Lapsing customers detected
Lapsing customers detected
This insight appears when RFM (recency-frequency-monetary) analysis flags customers who were active but have stopped buying. Use the action link to open the customer segment, then consider a re-engagement campaign or a targeted promotion. Outcome: recovering lapsing customers costs far less than acquiring new ones.
A channel shows a quality-gap signal
A channel shows a quality-gap signal
Some channels penalize incomplete listings in their ranking algorithm. Use the insight action to filter to the affected products on that channel and run a targeted enrichment pass. For the full picture, open Channel Comparison. Outcome: better channel listing quality improves organic visibility without ad spend.
SEO keyword opportunity detected
SEO keyword opportunity detected
The insight surfaces queries where you have impressions but low ranking. Click through to the SEO & Search report or use the action link to add those keywords to your tracking list, then enrich the relevant product descriptions. Outcome: moving from page 2 to page 1 on a high-impression query can multiply clicks without any additional budget.
Related
Strategy
Turn insights into a prioritized list of growth initiatives.
Data Quality
The catalog health that powers many of these insights.
Returns & Refunds
See how data quality drives the return rate.
Enrichment Impact
Measure the revenue lift after you act.