Everything on the Overview is your real catalog data, not a sample. A brand-new project shows a short activation checklist (connect a channel, import products, invite your team) instead of the dashboard, until there is data to summarize.
What’s on your dashboard
1
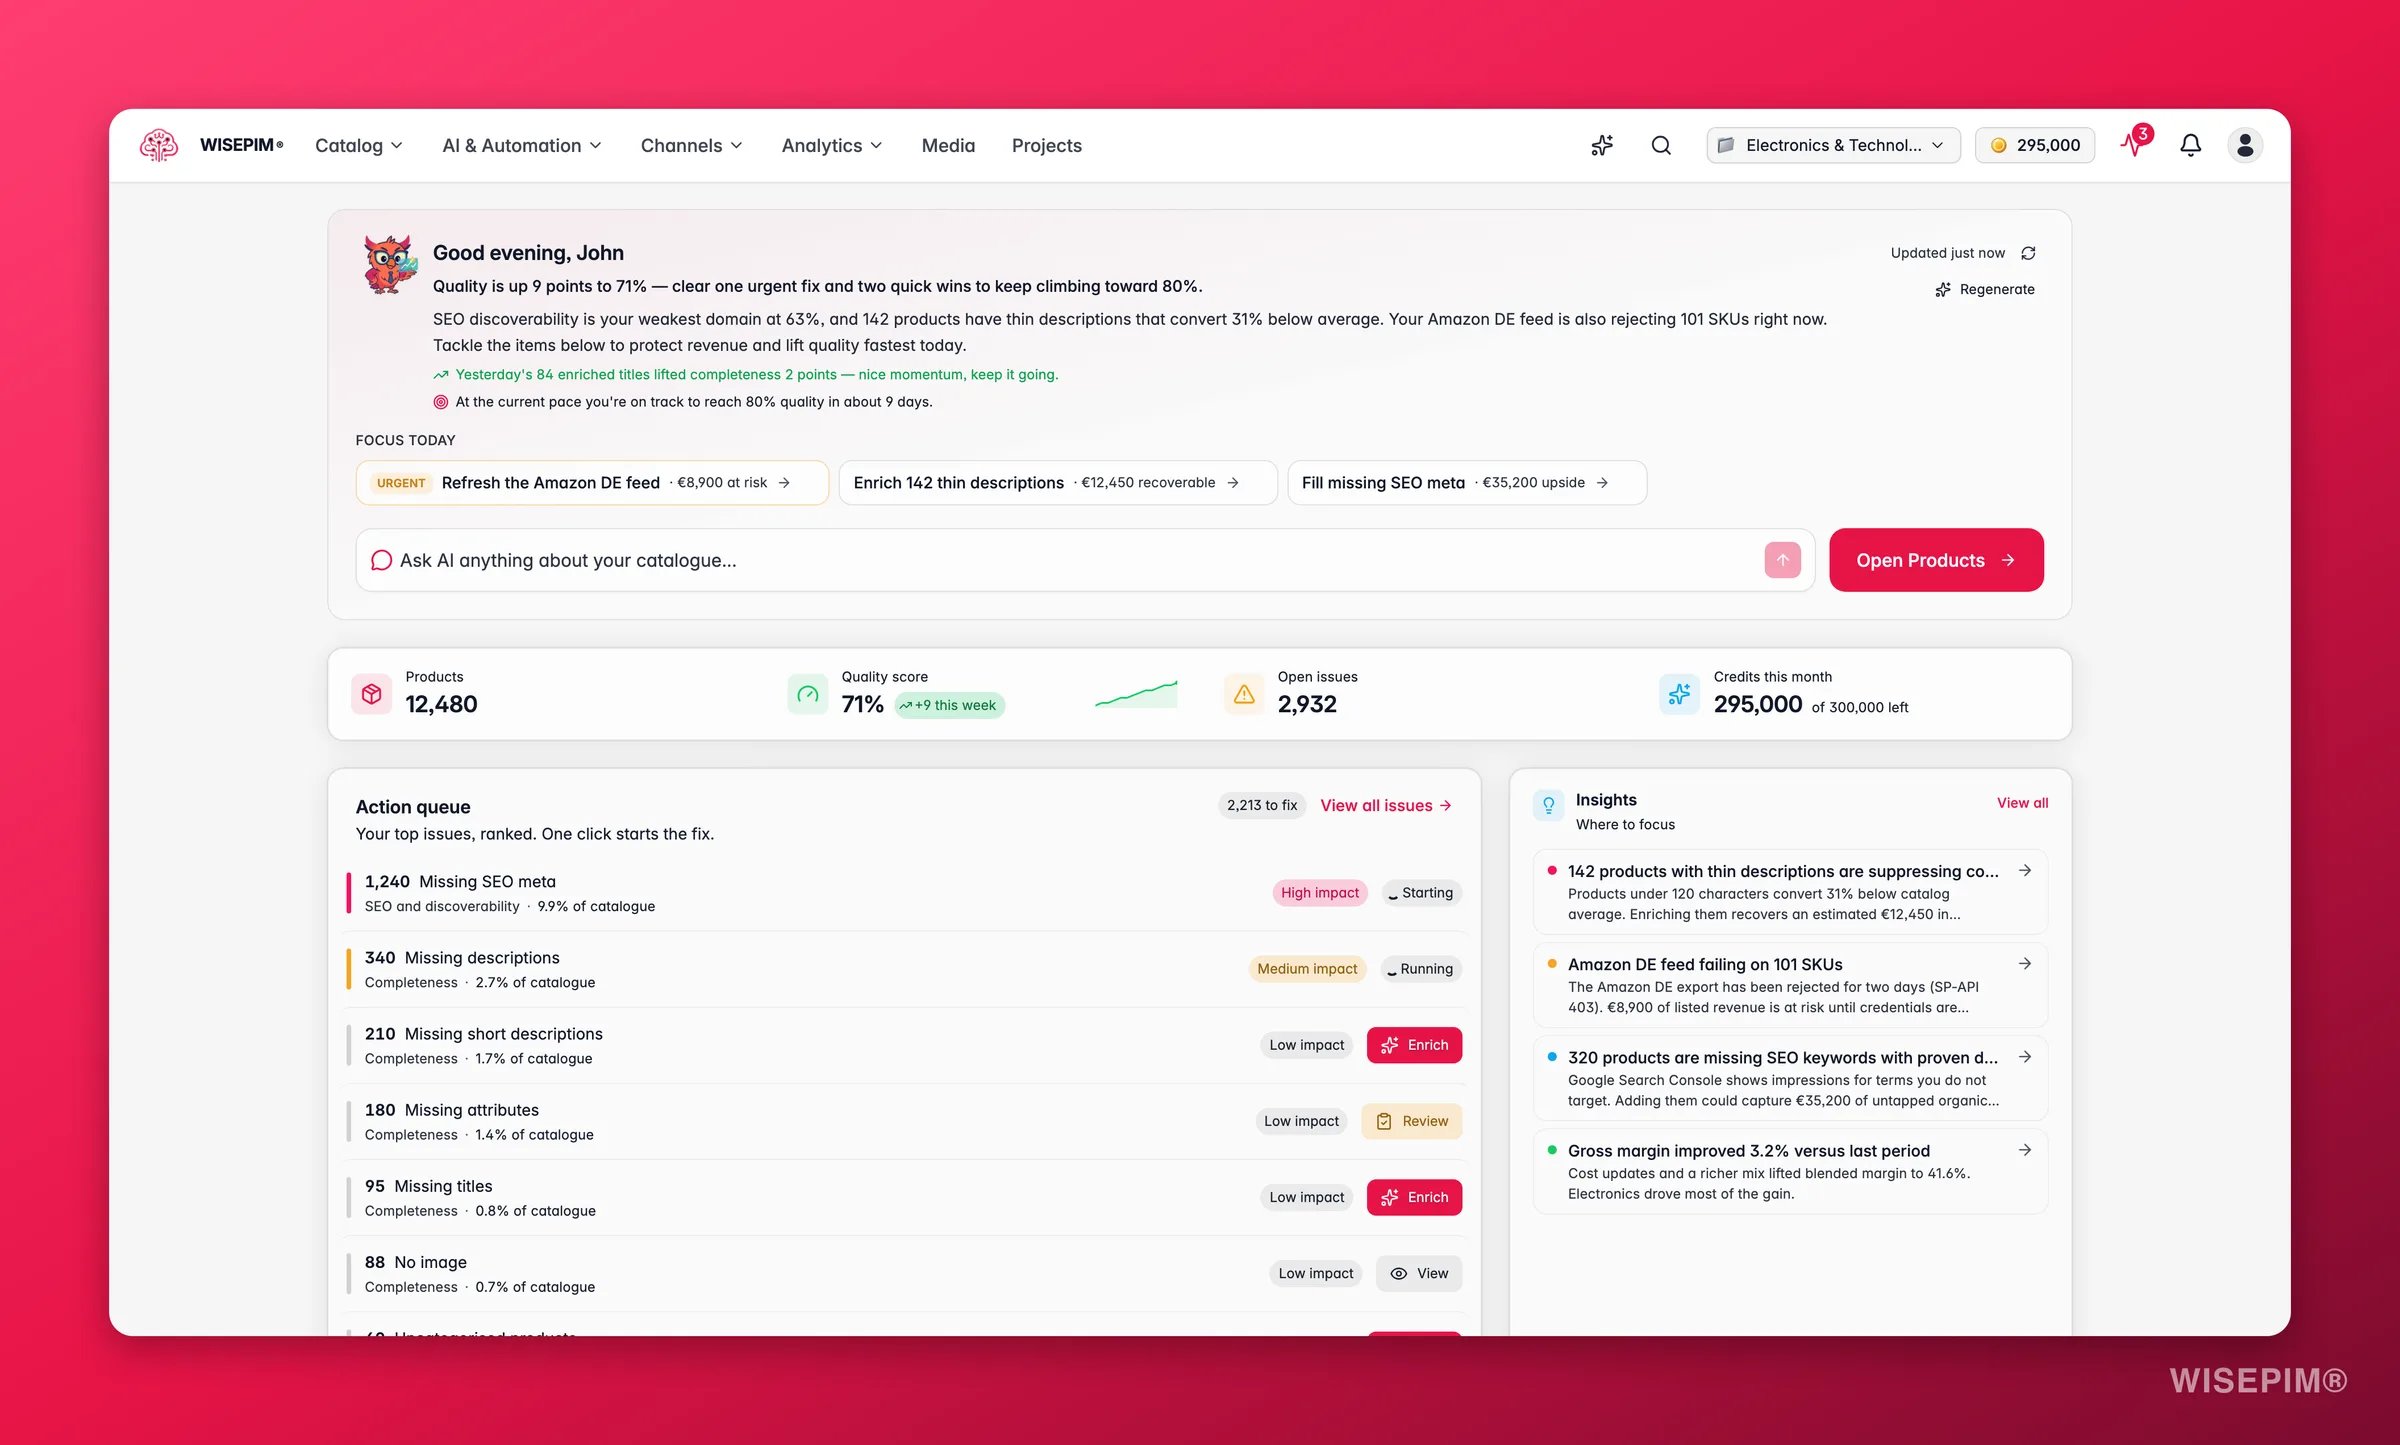
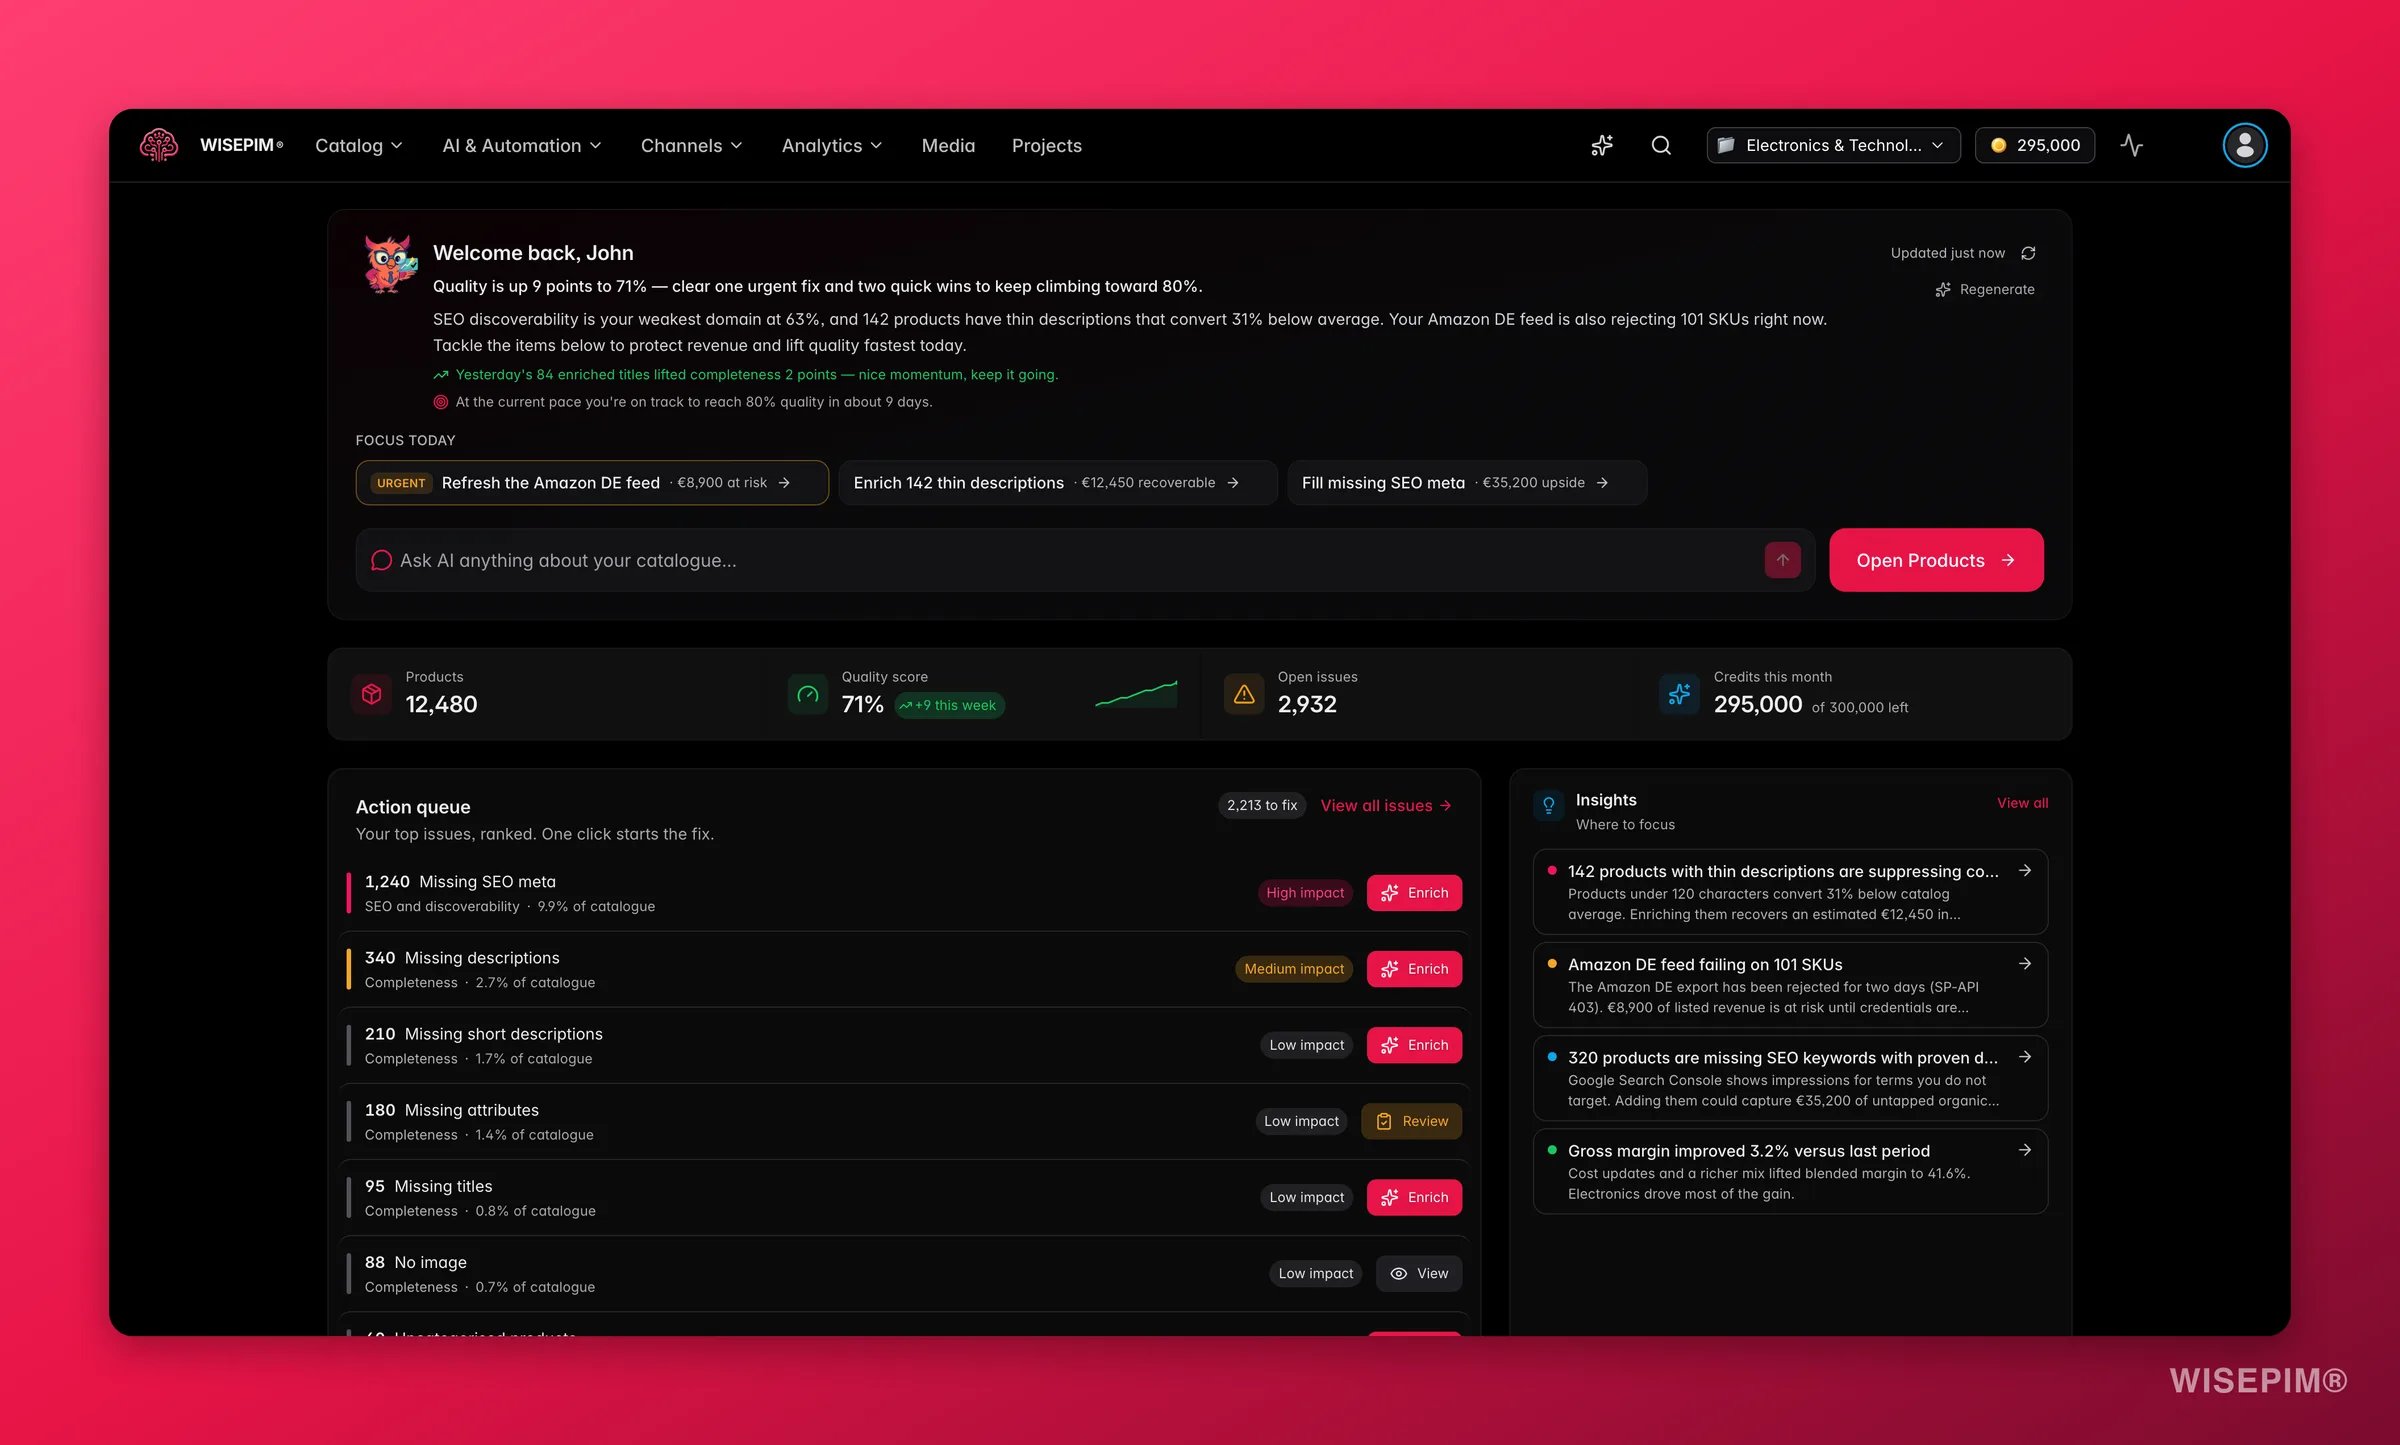
Health header
A greeting, your overall catalog-quality score with its trend since yesterday, the single biggest gap right now (for example “2,400 products missing a description”), and an Ask AI box that opens the assistant with your question pre-loaded.
2
Daily briefing
A short AI-written read on your catalog, with a handful of focus items to consider today. You get one briefing per project per day.
3
Quality pulse
Four sparklines tracking the 30-day trend of each quality domain: Completeness, Channel Readiness, SEO, and Conversion Potential. Each shows the current score and its change, so you see direction at a glance.
4
Action queue
A ranked inbox of the most worthwhile fixes (missing fields, weak images, untranslated content). Each row is a one-click action that queues the job and opens Products already filtered to the affected products.
5
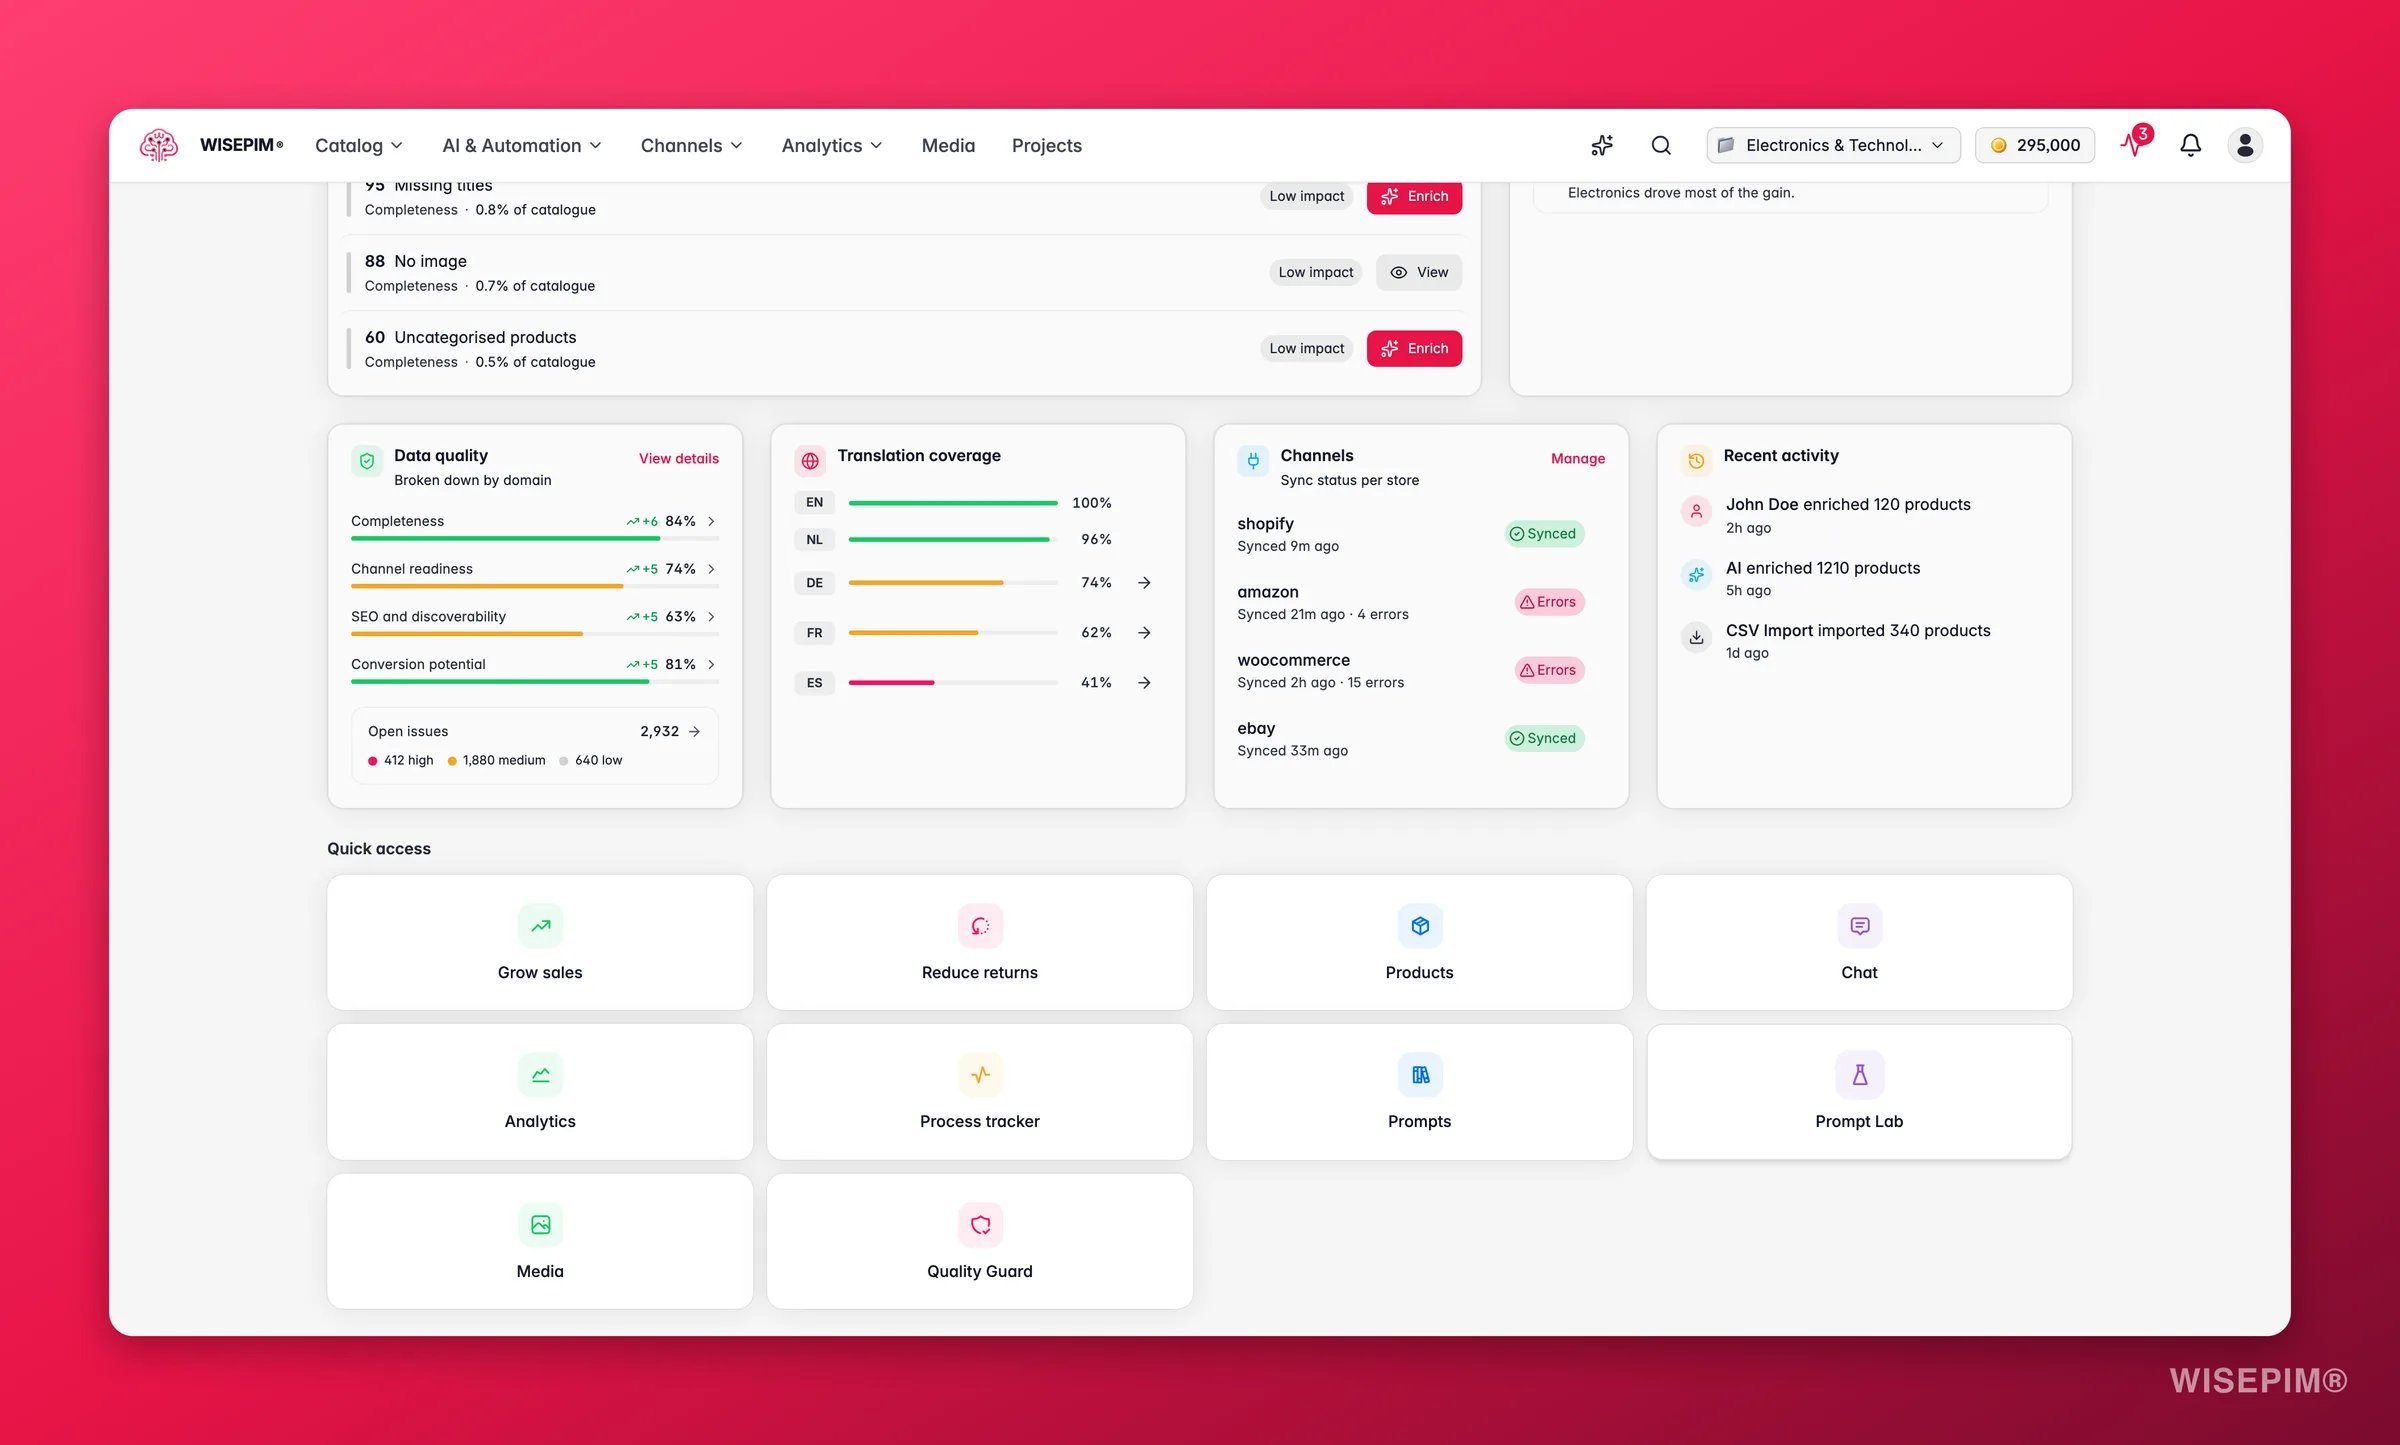
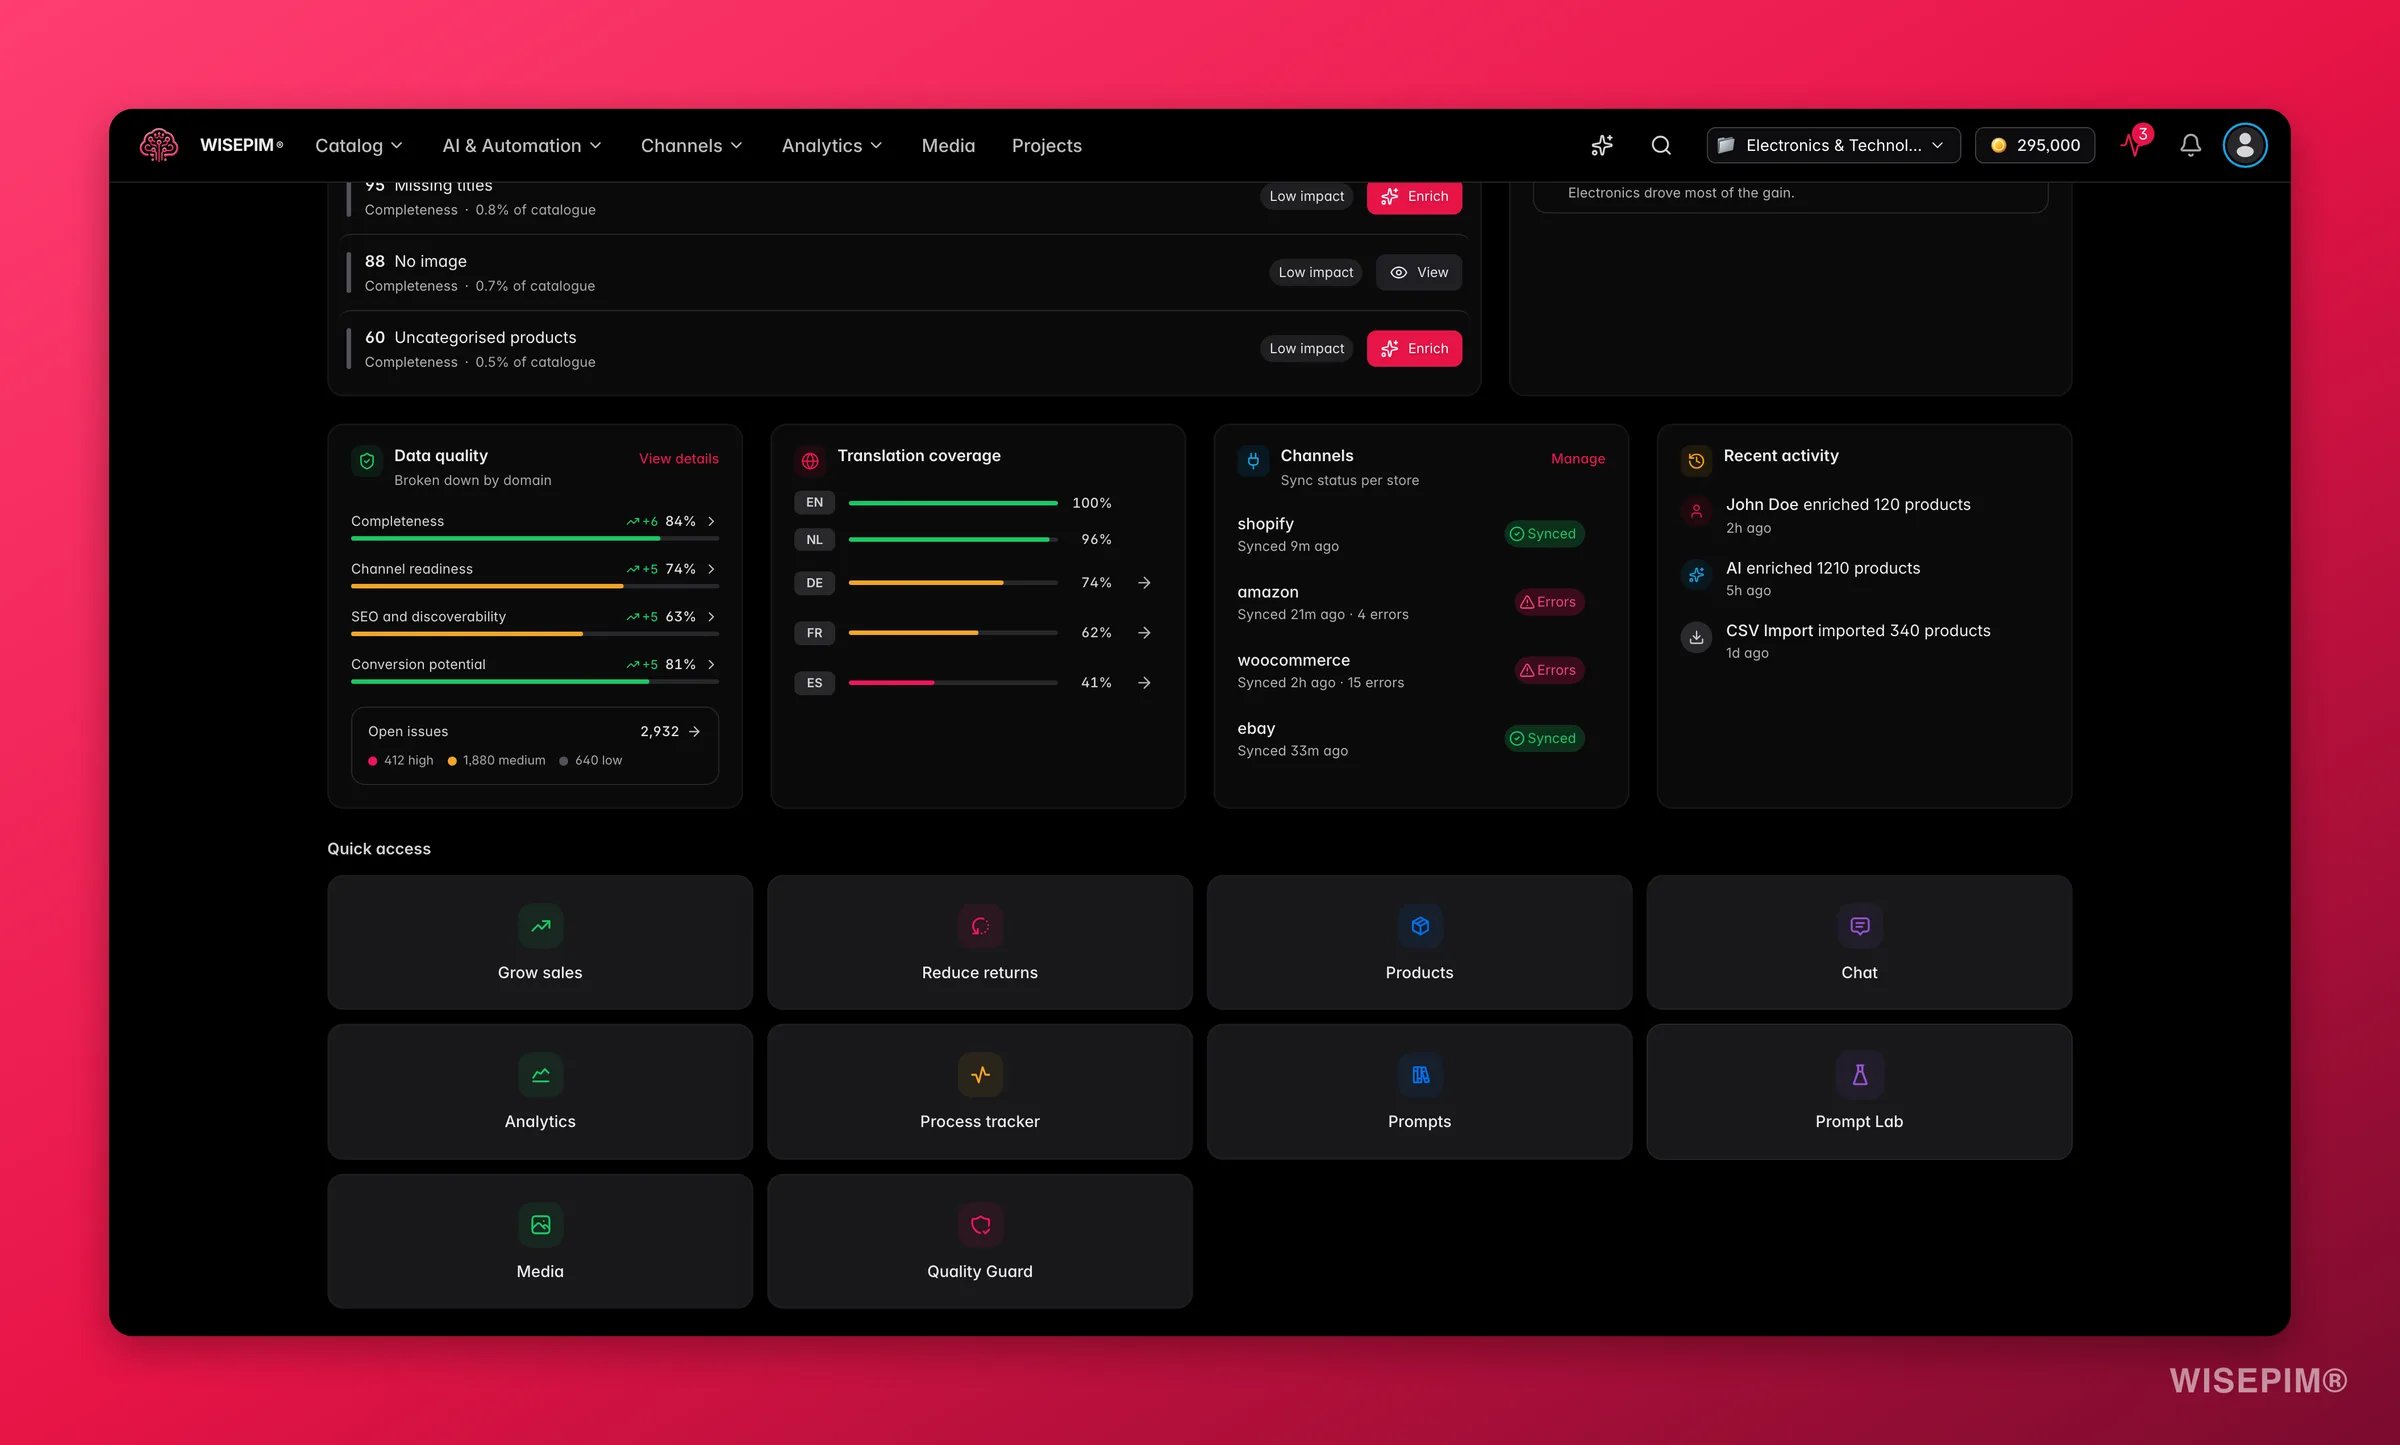
Catalog health and activity
Your worst-scoring product families, a completion funnel (how many products are fully vs partially done), locale coverage per language, channel sync status, and a live feed of recent edits, imports, and enrichment runs.
6
Quick launcher
An eight-tile launcher to the tools you reach for most: Products, Chat, Analytics, Process Tracker, Prompt Library, Prompt Lab, Media, and Quality Guard.
Your daily briefing
Once a day, per project, WISEPIM writes you a briefing: a plain-language summary of what changed in your catalog and a short list of focus items worth your attention. Each focus item can be handled in place:- Mark it done when you have dealt with it.
- Rate it with a thumbs up or thumbs down. This teaches WISEPIM which suggestions are useful to you.
- Dismiss it if it is not relevant. That focus stays out of your briefings for the next 14 days.
Start from a goal instead
The action queue is organised by score impact. If you would rather start from a business outcome, the top navigation has two goal hubs that group the same work differently:- Grow sales walks you through getting found in search, covering more sales channels, making listings that convert, and protecting your margin.
- Reduce returns treats returns as a data problem: fix the riskiest products first, prevent the next batch, and watch your return rate.
Reading the dashboard
- The trend on the health header is the fastest signal. A drop overnight usually means an import or a channel sync brought in incomplete data. Open the action queue to see exactly what slipped.
- Two pulse sparklines diverging is informative: Completeness rising while Conversion Potential falls means you are filling fields that do not influence buyers. Rebalance toward the dimension that pays.
- The action queue is already prioritized by how many products each gap touches and how much it moves your score, so working top-down is the most efficient path.
- The worst-families list tells you where to concentrate. Fixing one weak family often lifts the blended score more than scattering effort across the catalog.
Act on what you find
Your quality score dropped overnight
Your quality score dropped overnight
A sudden drop almost always traces to fresh data. Check the recent-activity feed for an import or sync, then open the action queue: it will already list the new gaps (missing descriptions, images, or attributes). Fire the matching one-click job. Outcome: the drop is reversed within the same session, before those products reach a channel.
A product family is dragging the score down
A product family is dragging the score down
Click the family in the worst-families list to open Products filtered to it, then run a targeted enrichment on the missing fields. Outcome: lifting one weak family raises the blended catalog score more than piecemeal fixes elsewhere.
You want the deeper numbers behind a pulse
You want the deeper numbers behind a pulse
Each quality domain links into the Analytics reports, where you can see field-level health, the per-channel readiness matrix, and the historical trend. Outcome: you move from “the score is down” to “these five fields on these products are the cause.”
You are not sure what to do first
You are not sure what to do first
Type the question into the Ask AI box in the header. The assistant opens with your catalog context already loaded and can point you at the right report or action. Outcome: a clear next step without hunting through menus.
Related
Analytics Hub
The full reporting suite behind the Overview’s pulse and health numbers.
Data Quality
Field-level health, quick wins, and the fix workspace.
Managing Products
Where the action-queue jumps land, filtered and ready to fix.
Quick Win
A guided first run that shows the dashboard come to life.
Weekly catalog health routine
A 45-minute Monday ritual that turns this dashboard into a repeatable habit.