Returns are eating your margin. Treat them as a data problem: find the content causing them, fix the worst offenders, and prove the rate moved.
Returns are the quietest way to lose money. The sale already happened, the marketing already got paid for, and then the product comes back and takes the margin with it. The instinct is to blame the products, but a large share of returns are customers receiving something other than what the page led them to expect.That makes it a data problem, and data problems are fixable. This guide is the loop: prove the cause, fix the worst offenders, guard against a repeat, and re-measure with a real before and after. Budget about two hours of hands-on work, then three to four weeks of waiting for the evidence.
Before you start: you need order history with return or refund data flowing in from a connected platform - the Returns & Refunds report is what this whole guide reads from.
What you’ll get: a documented baseline, the specific products driving your returns fixed, a rule stopping the same gap from re-entering, and a trend line that shows whether it worked.
Do not enrich anything yet. The first job is to find out whether better data will help at all, because if the cause is fit or the product itself, enrichment will burn credits and change nothing.
1
Write down your baseline
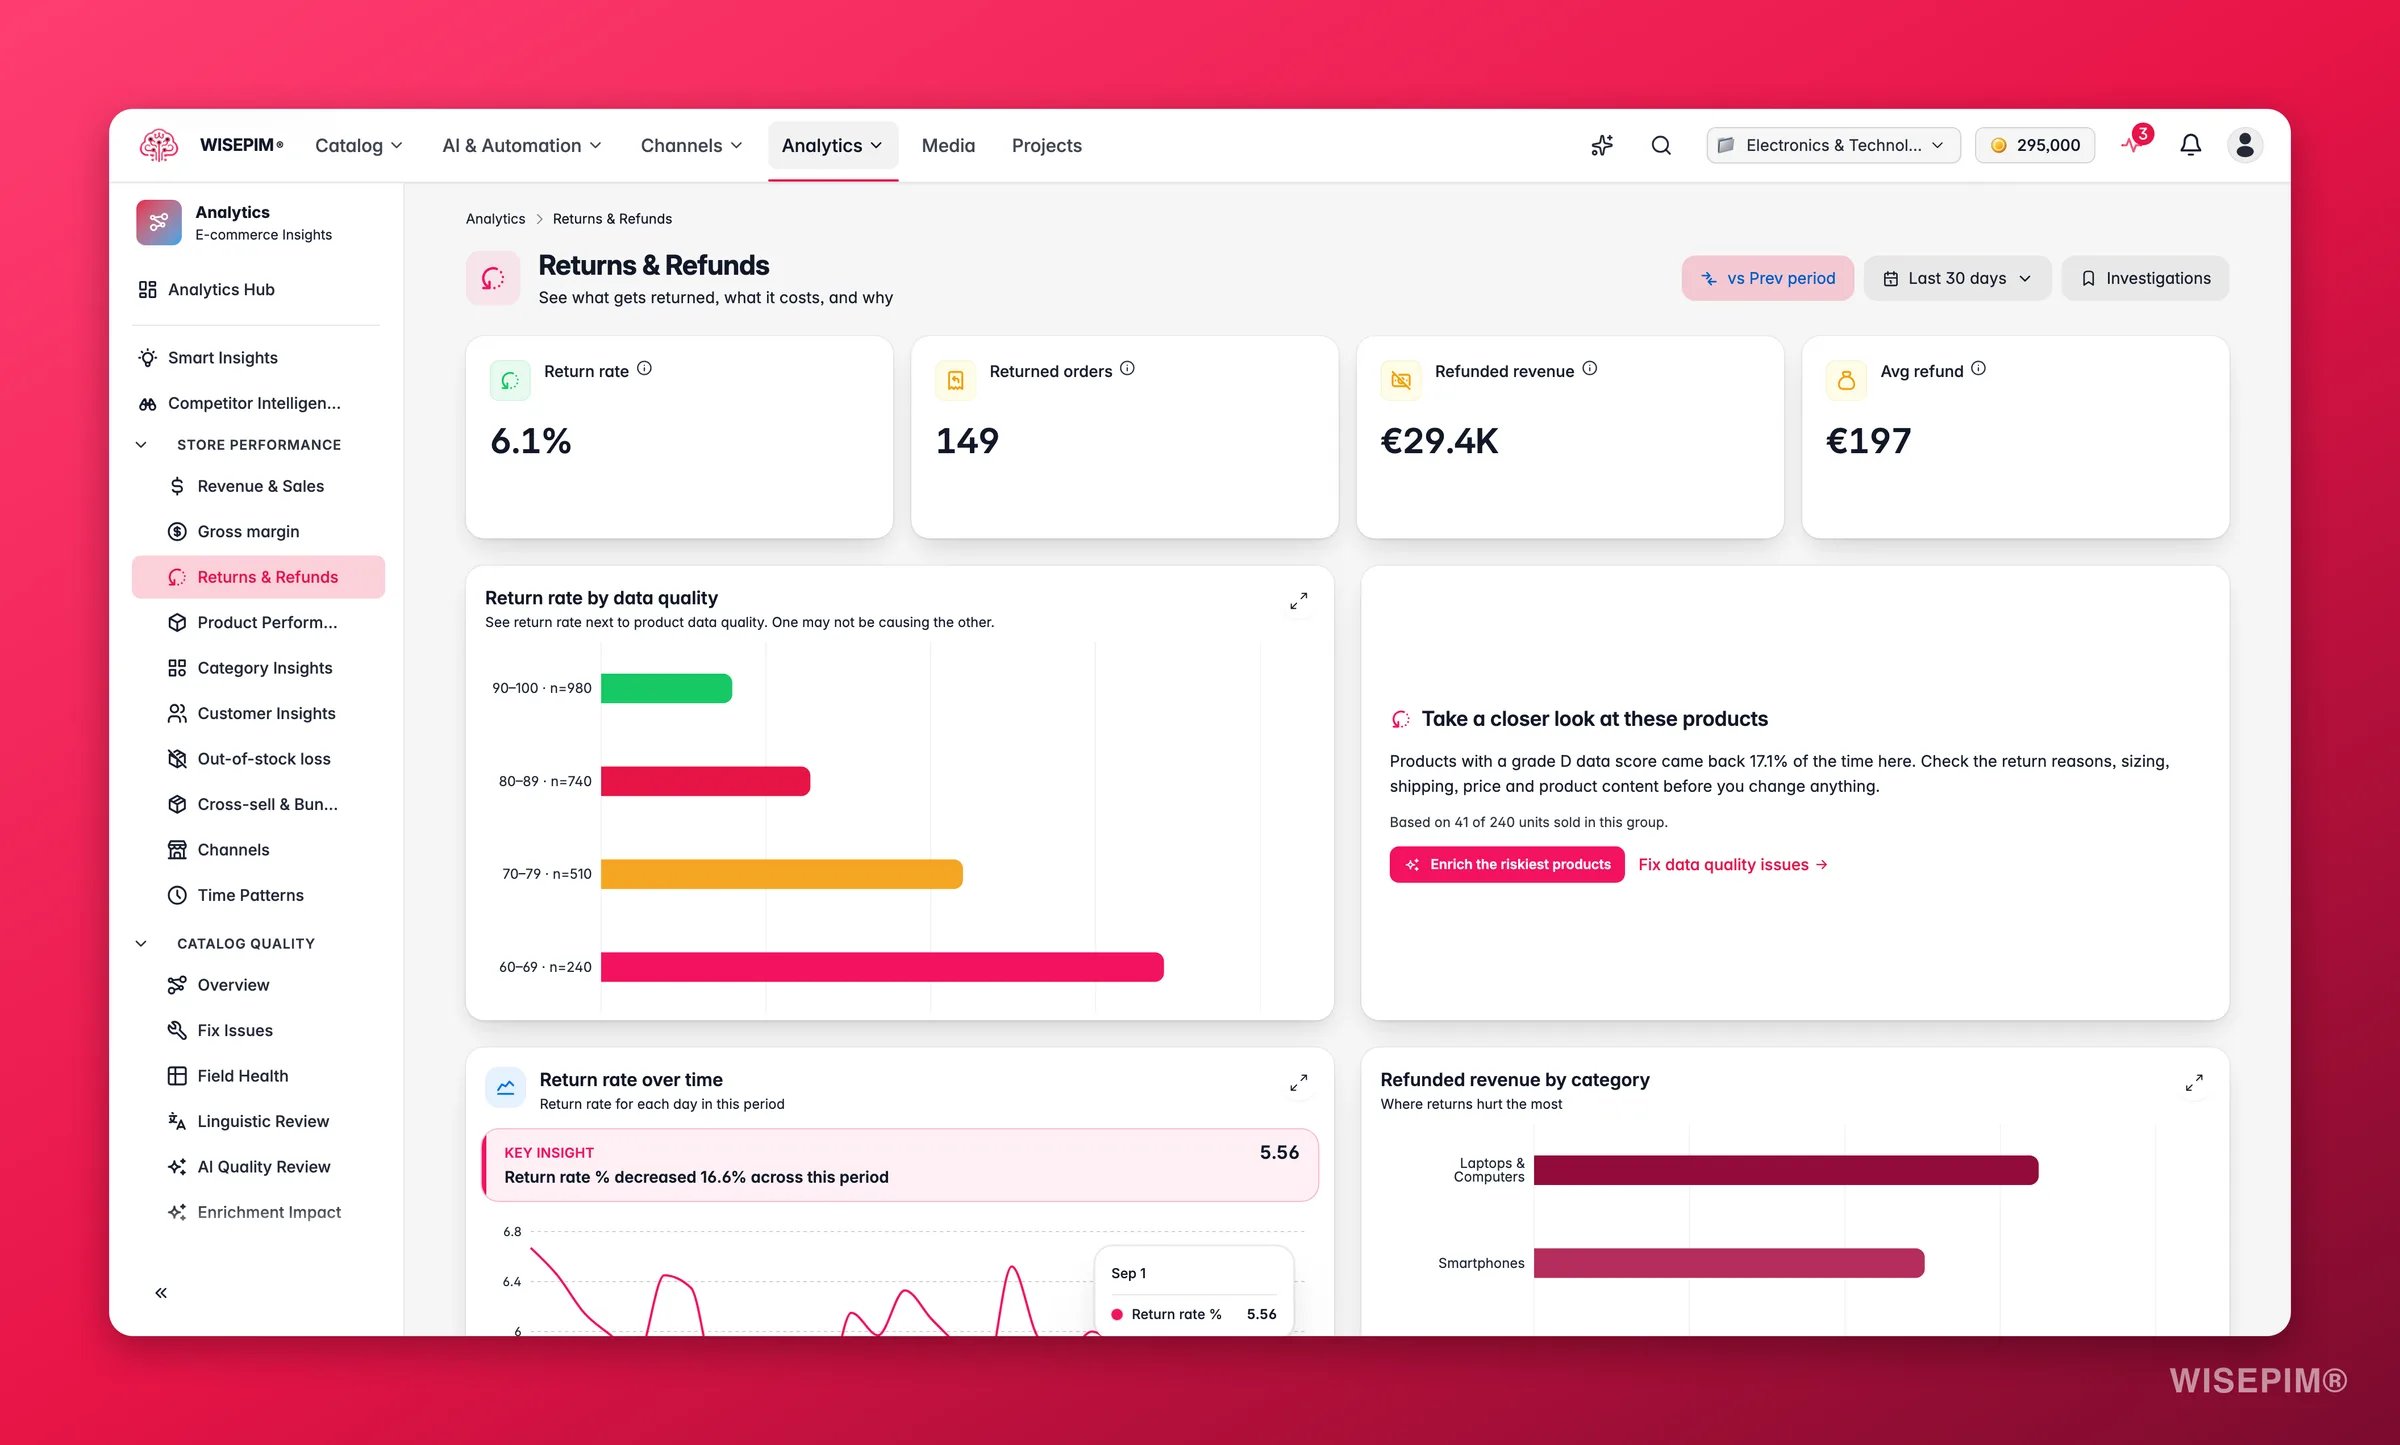
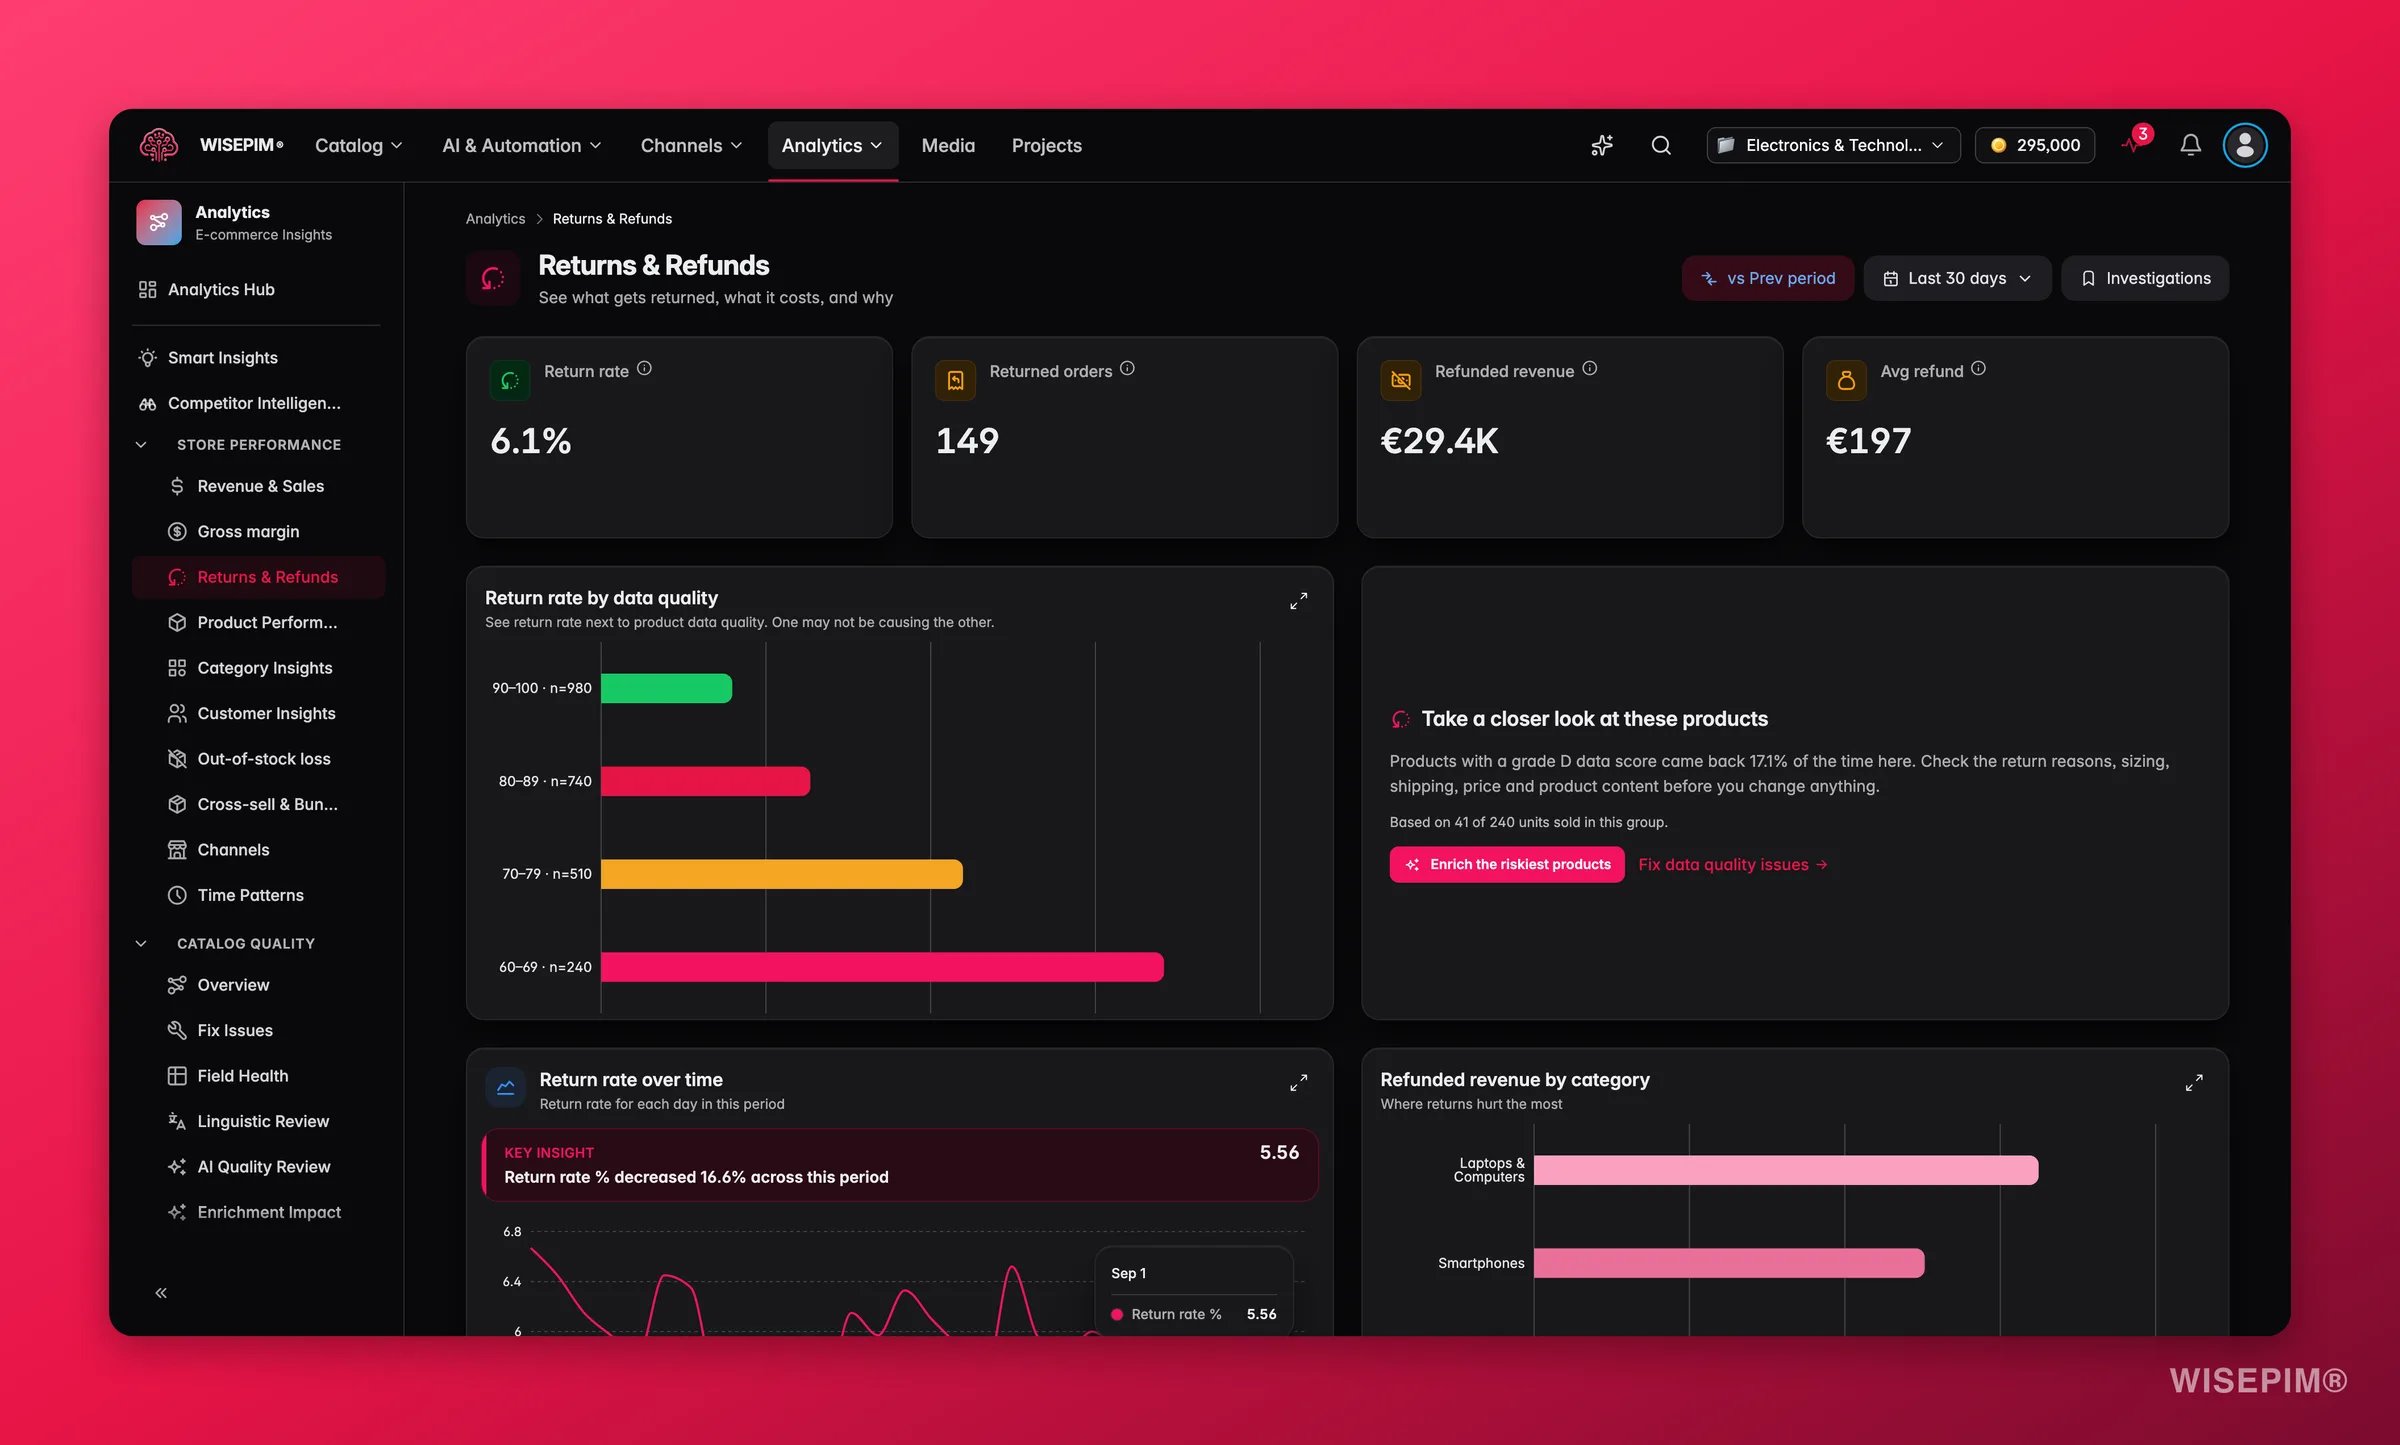
Open Returns & Refunds from the Analytics sidebar and record the return rate, returned orders, and refunded revenue for the current period. The report shows directional benchmarks beside them so you can tell a normal number from an alarming one. Everything later in this guide is measured against these three, so capture them before you touch anything.
2
Read the return-rate-by-quality-grade chart
This single chart decides your strategy - read it before anything else on the page. It ranks return rate per quality grade, A through F, and the insight card names your worst band outright.
3
Check the top return reasons
Where item-level data is available, the reasons are ranked. “Not as described” is the one that maps directly to content - it is the customer telling you the page lied to them. A reason list dominated by sizing or changed-my-mind points somewhere else.
4
Pick your worst offenders
Use the most-returned-products table to build your target list, sorting for products that combine a low quality grade with high order volume. A grade F product that sells twice a year is not your problem; a grade D product that sells 400 times a month is. Products in that table with a high quality score are the opposite signal - those are fit or product problems, so leave them off the list.
The shape of that chart is the whole decision:
What you see
What it means
What to do
Steep gradient - grade F returning at roughly 3× grade A
Content is the primary driver. Grade A and B products return less because their pages set accurate expectations
Continue with this guide. Improving descriptions, images, and specs moves the needle faster than any other intervention
Flat gradient - every grade returning at a similar rate
The cause is product fit, sizing, or expectation, not missing information
Stop here. Read the report’s guidance on fit problems: size guides, compatibility information, more realistic lifestyle images. Enrichment will not move this
Now work the target list. The order matters: understand what is wrong before you generate anything, and always test on one product before you commit the run.
1
Open the worst offenders in Data Quality
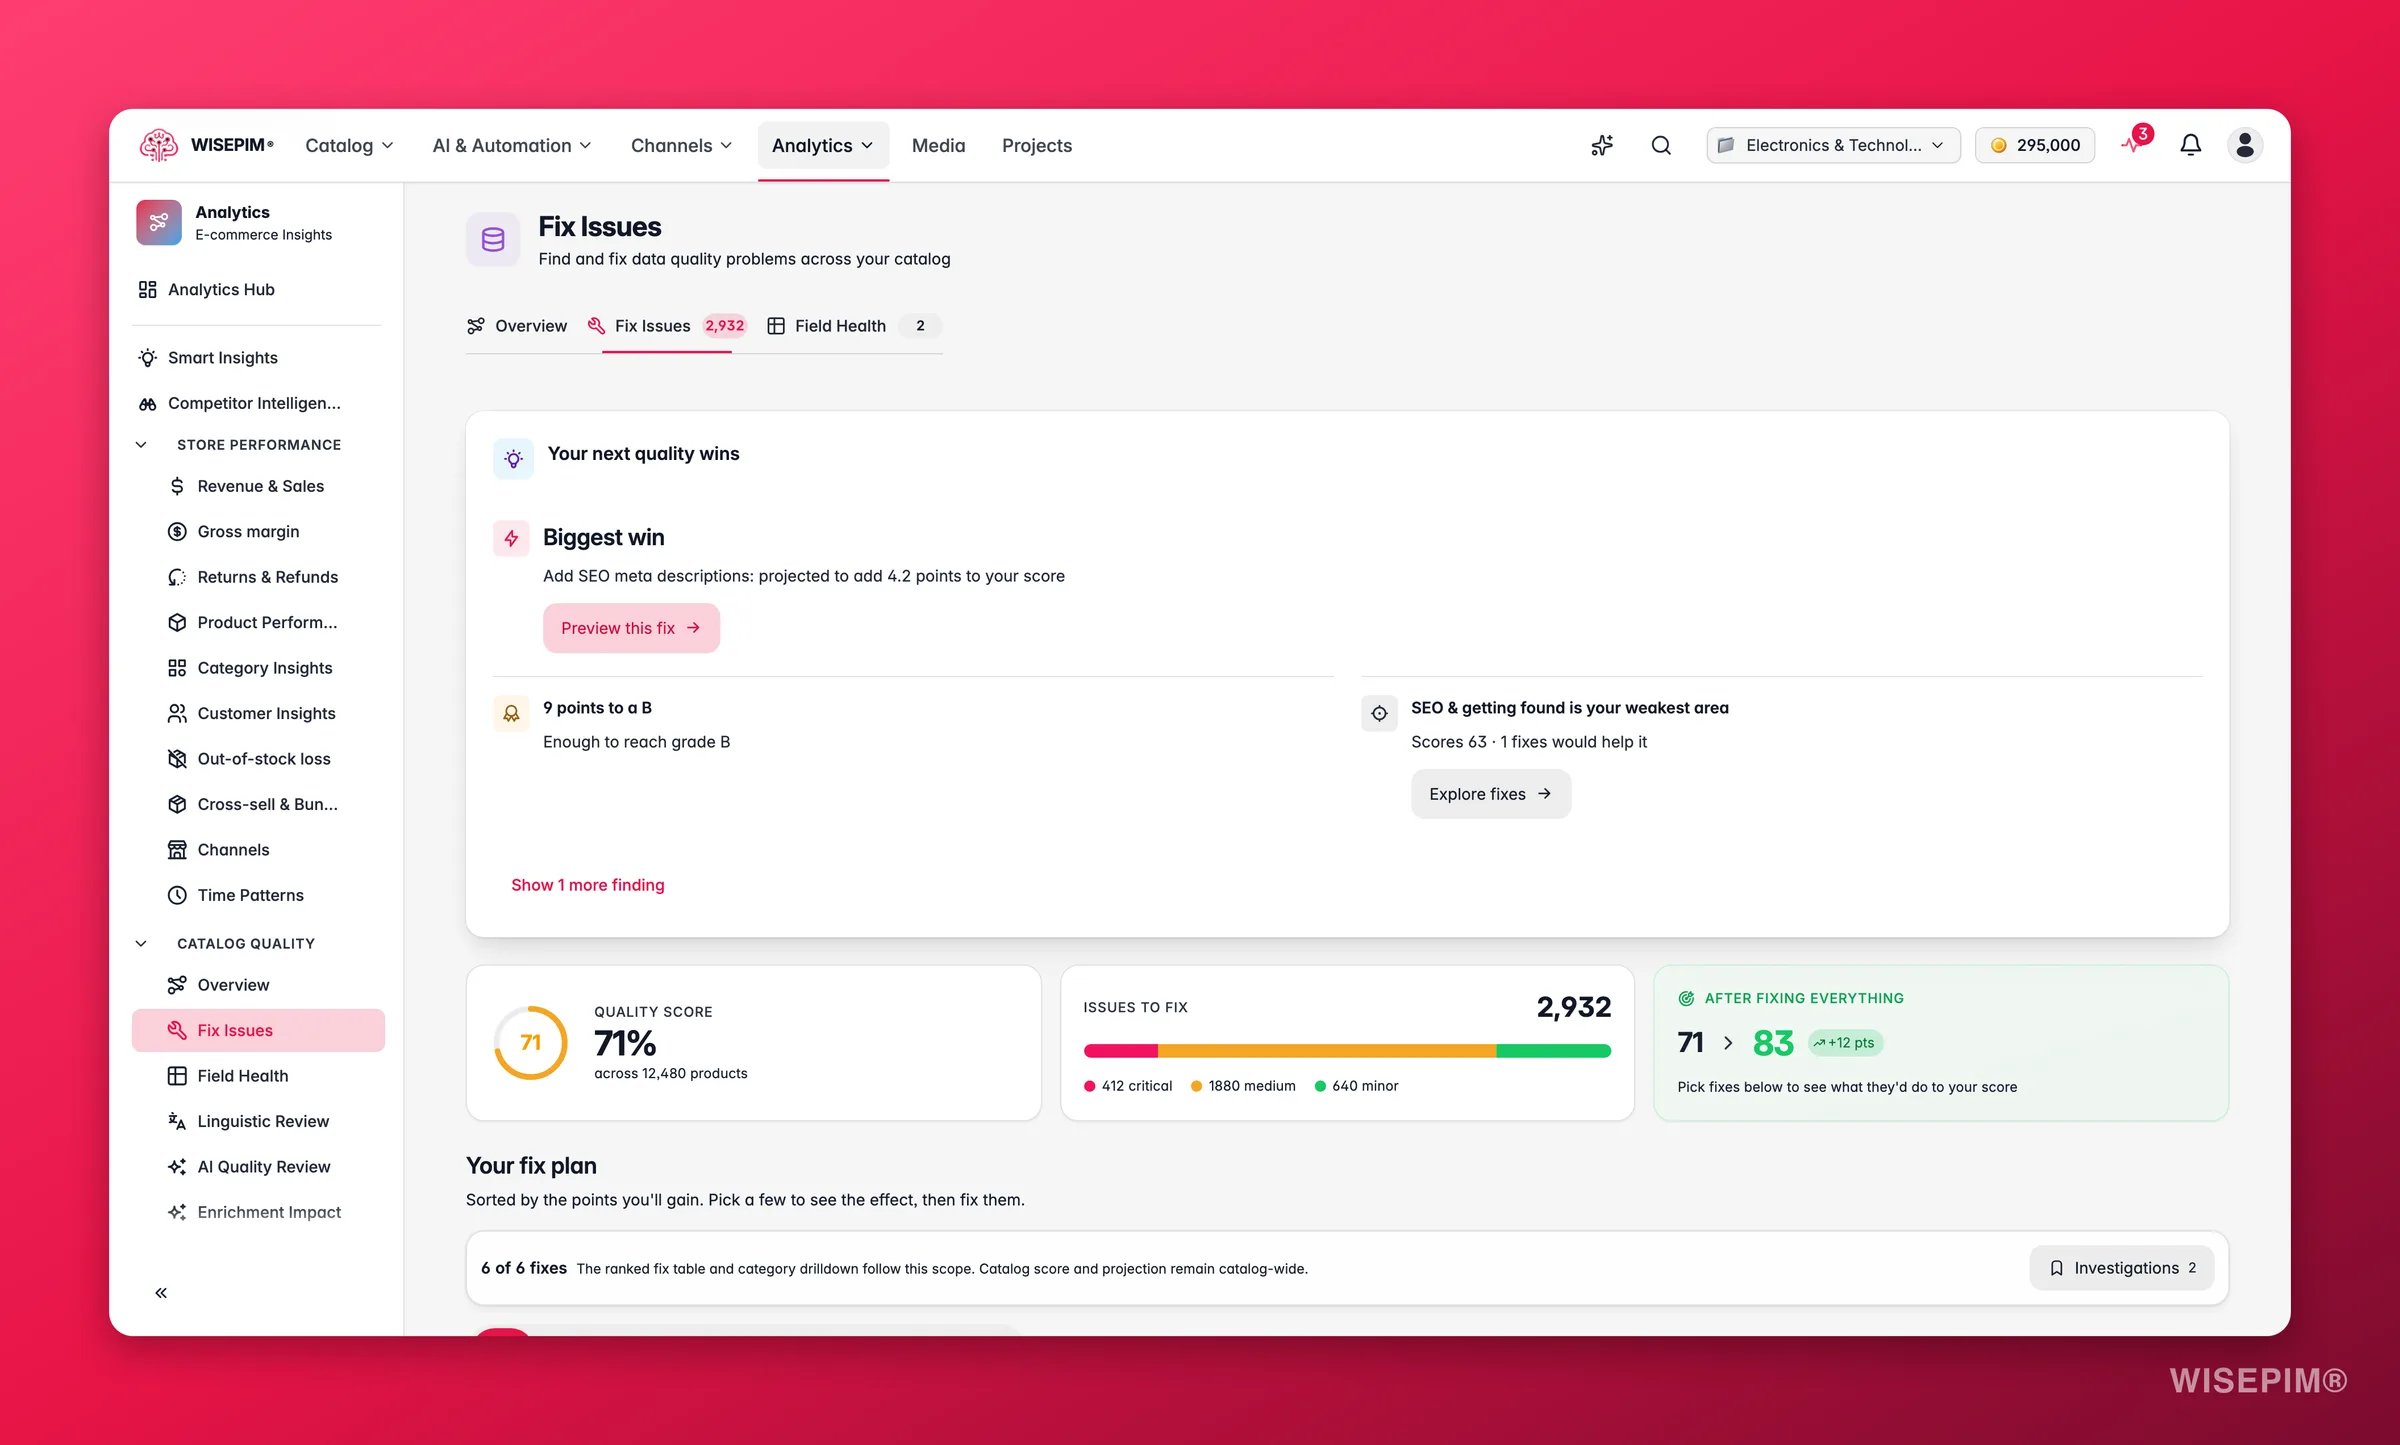
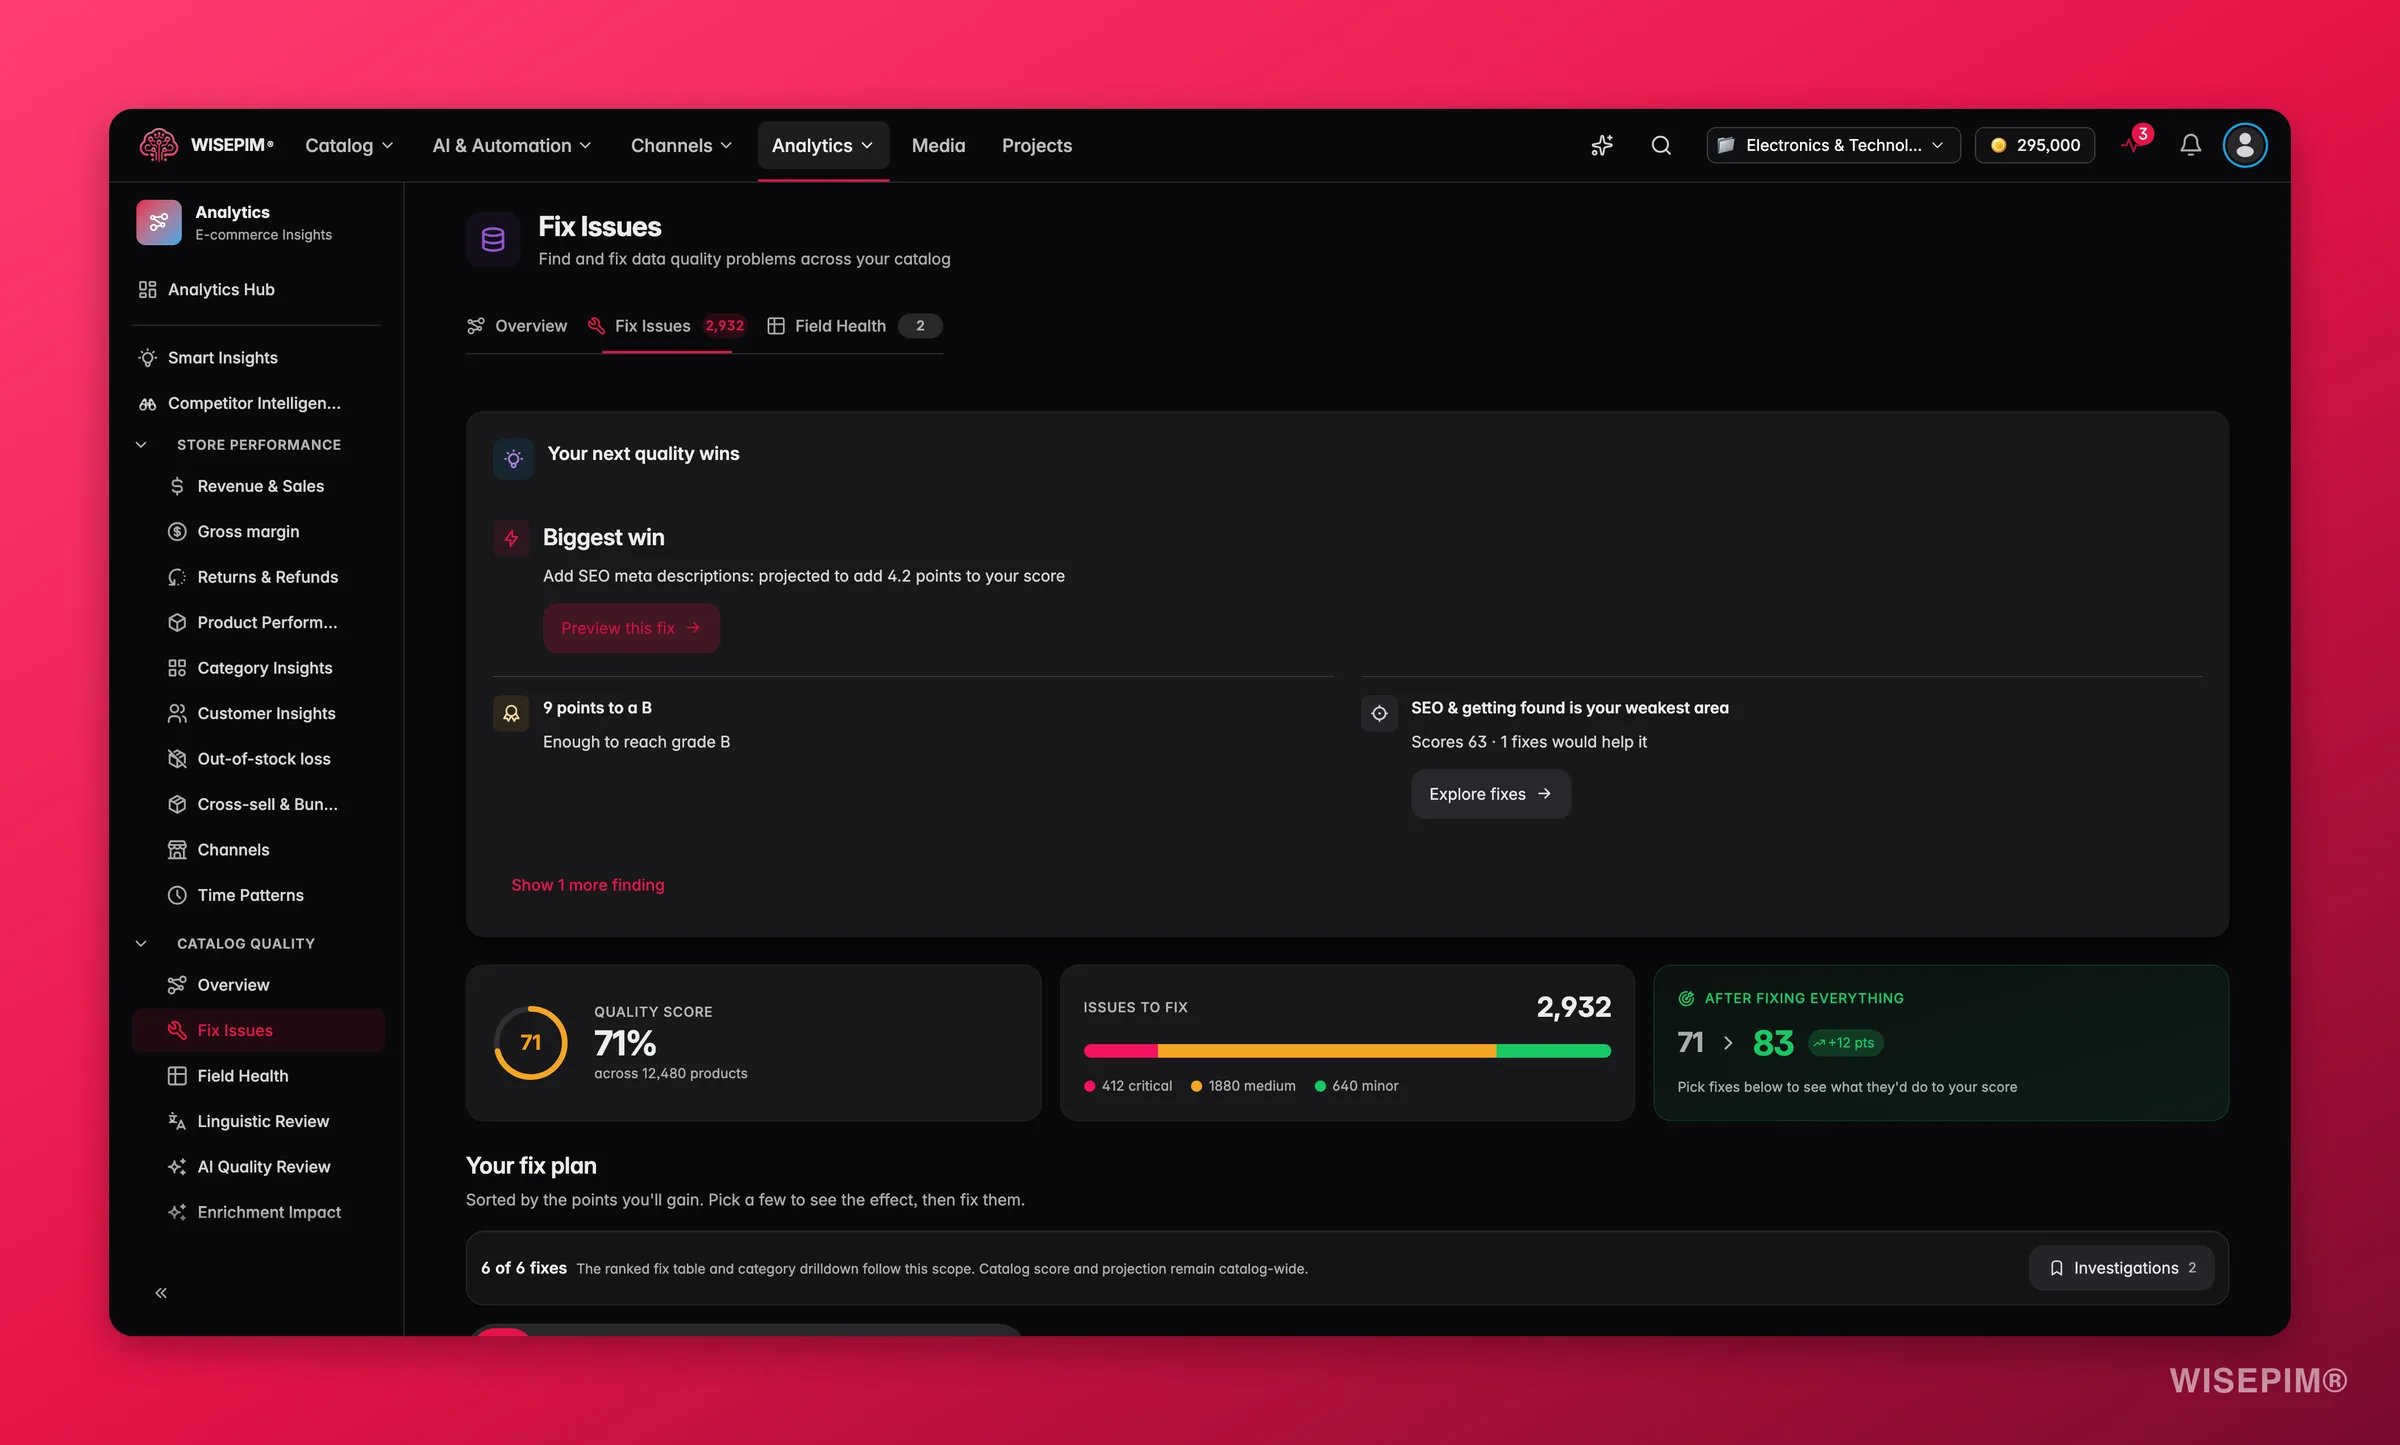
Take your grade D and F, high-volume list into Data Quality and switch to the Fix Issues tab using the tabs at the top of the section. Sort Quick Wins by impact to turn “these products are bad” into a specific, countable gap.
2
Use the Fix with AI drawer, and test on one first
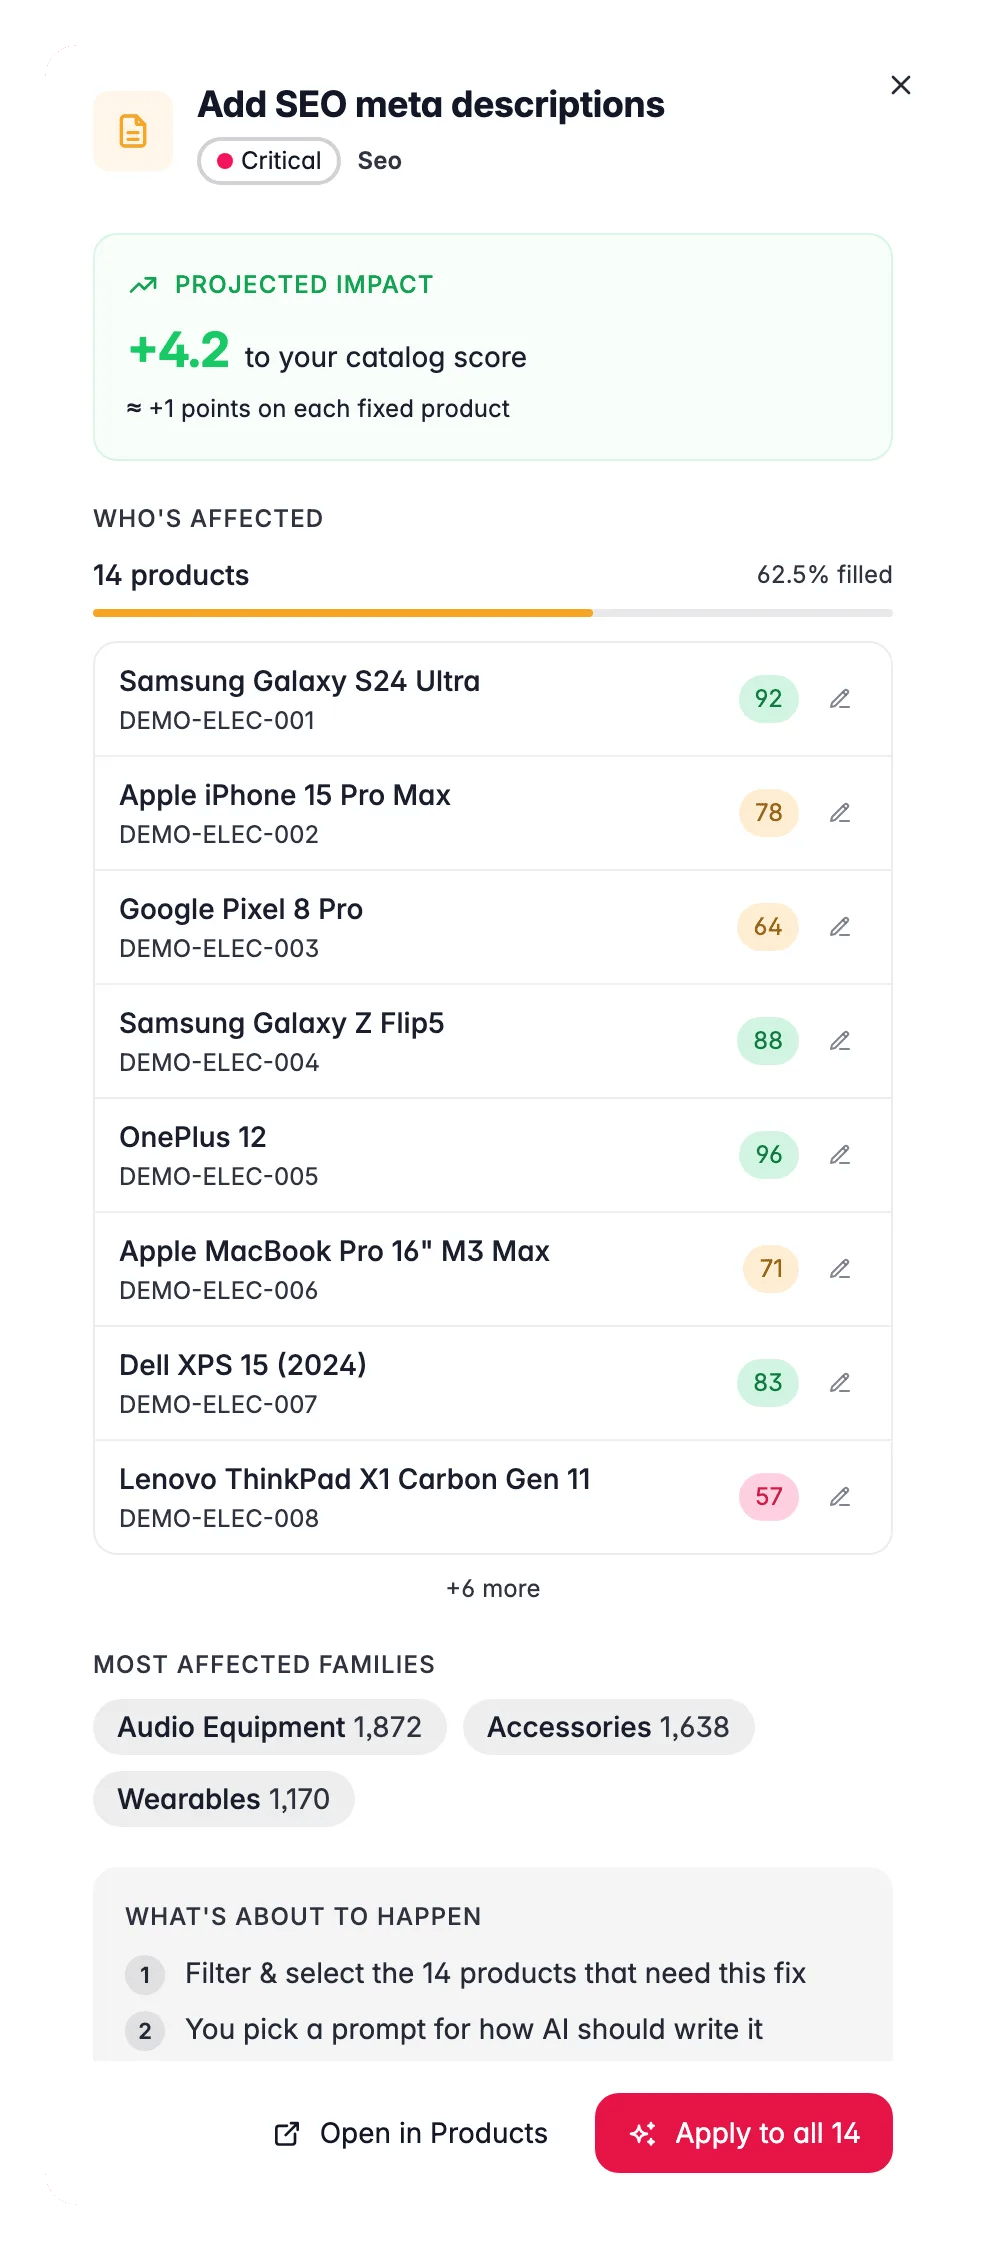
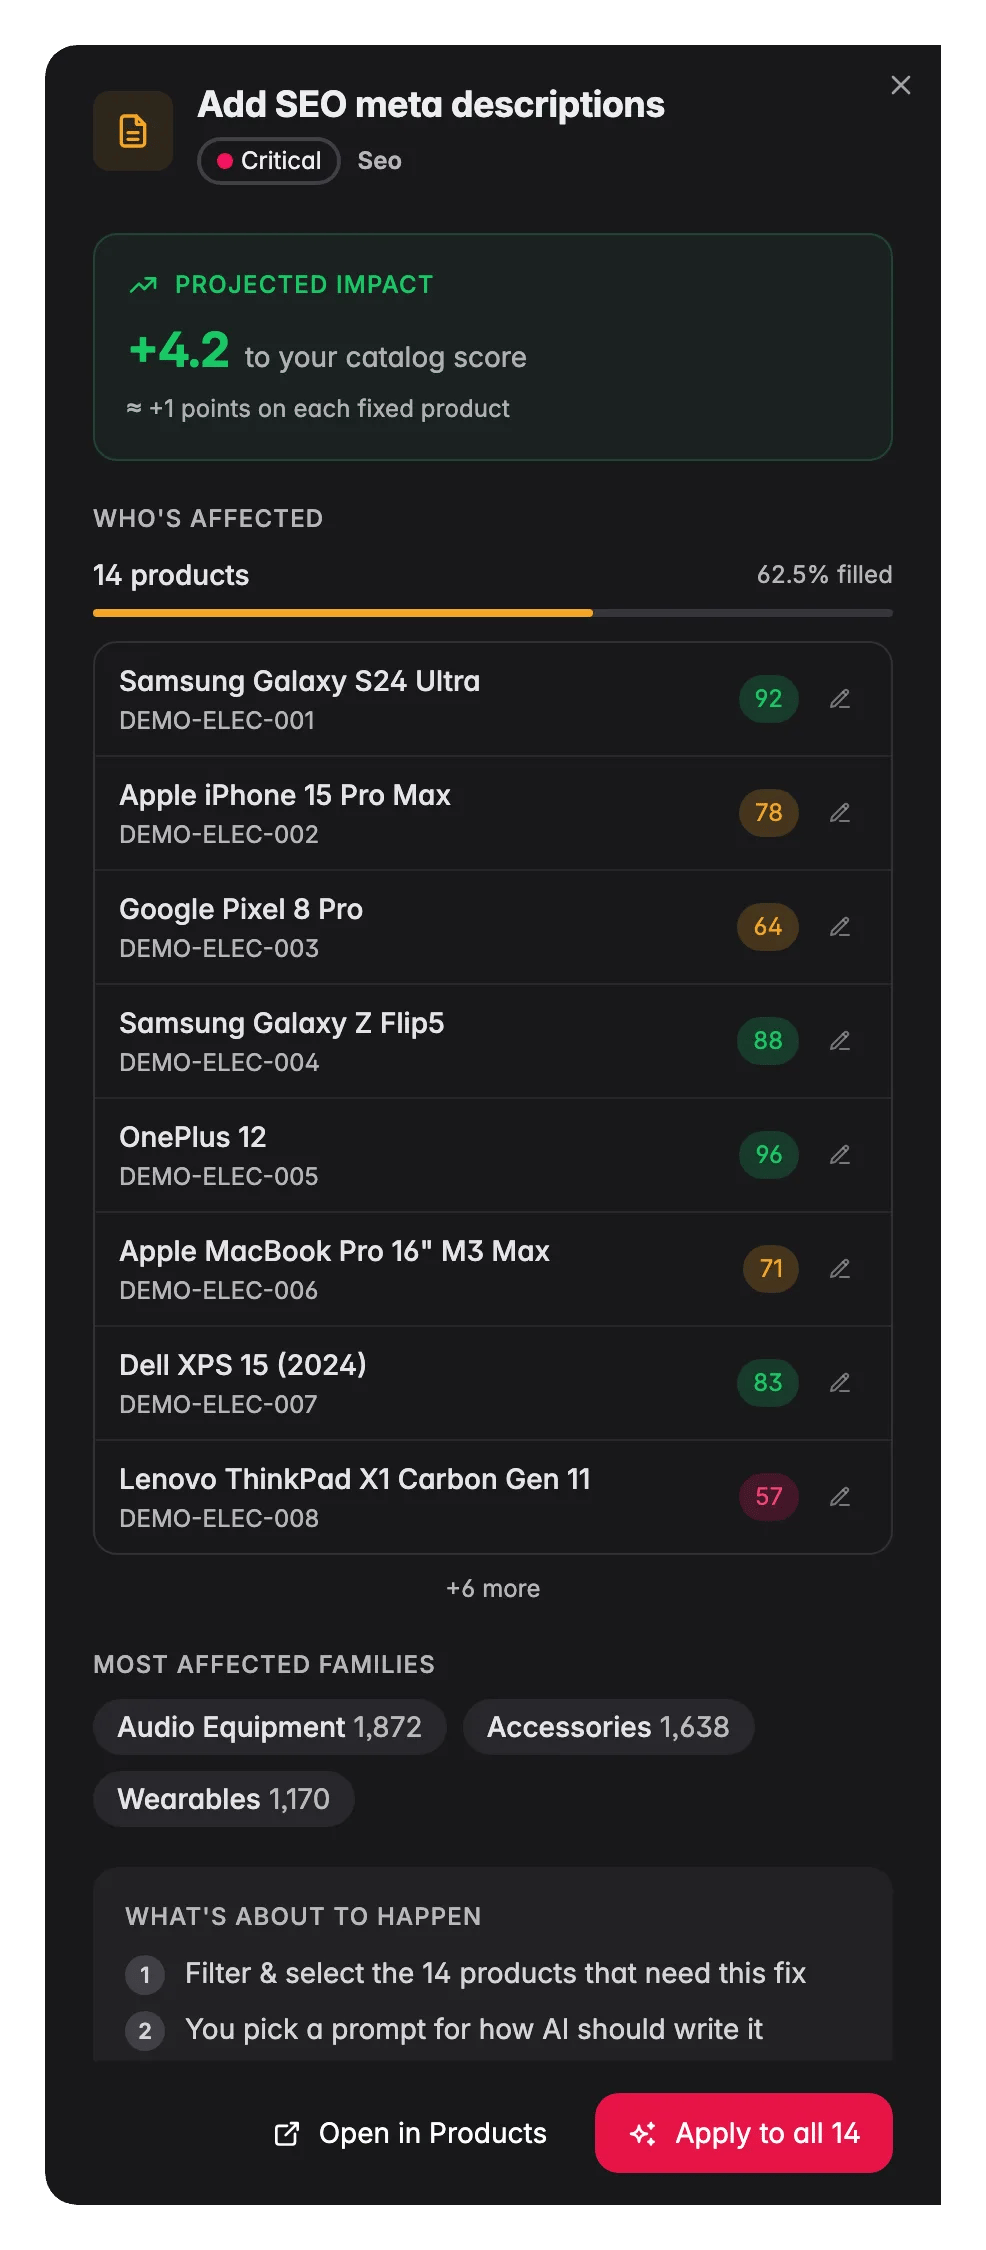
Every Fix with AI button opens the same review drawer, and nothing is written until you say so. Read Projected impact and Who’s affected, click Test on one to see a before-and-after for a single product, and only then Apply to all. Skipping the test is how a bad prompt reaches 400 products.
3
Run an AI Quality Review on the target list
AI Quality Review reads each product like a demanding customer across 12 dimensions and ranks the findings; results are ready in a few minutes. For returns, watch the mismatch dimensions: Image vs Data, Image vs Description, Semantic Consistency, Cross-field Math, and Conversion Readiness. Those are where a shopper’s expectation and the parcel diverge.
4
Fill the specs a shopper needs to be sure
Missing dimensions, materials, and compatibility are what make people guess, and guessing produces returns. Start with attribute extraction at 1 credit per product - it pulls specs out of text you already have, but only into attributes that exist on the product family, and it never invents new ones. Where coverage stays low because the facts genuinely are not in your text, run Web Research and extract again.
5
Audit the images and their alt text
Wrong or misleading images are a leading cause of “not as described”. Review the gallery for your target products in the Media Library, opened from the main navigation, then run Image Alt Text - it only fills images that have no alt text at all and never overwrites what you wrote, so it is safe to run broadly.
Fixing today’s products without changing tomorrow’s intake means doing this again after the next supplier import. Close the loop before you measure, because the measurement window starts at publish, not at enrichment.
1
Turn the gap you just fixed into a rule
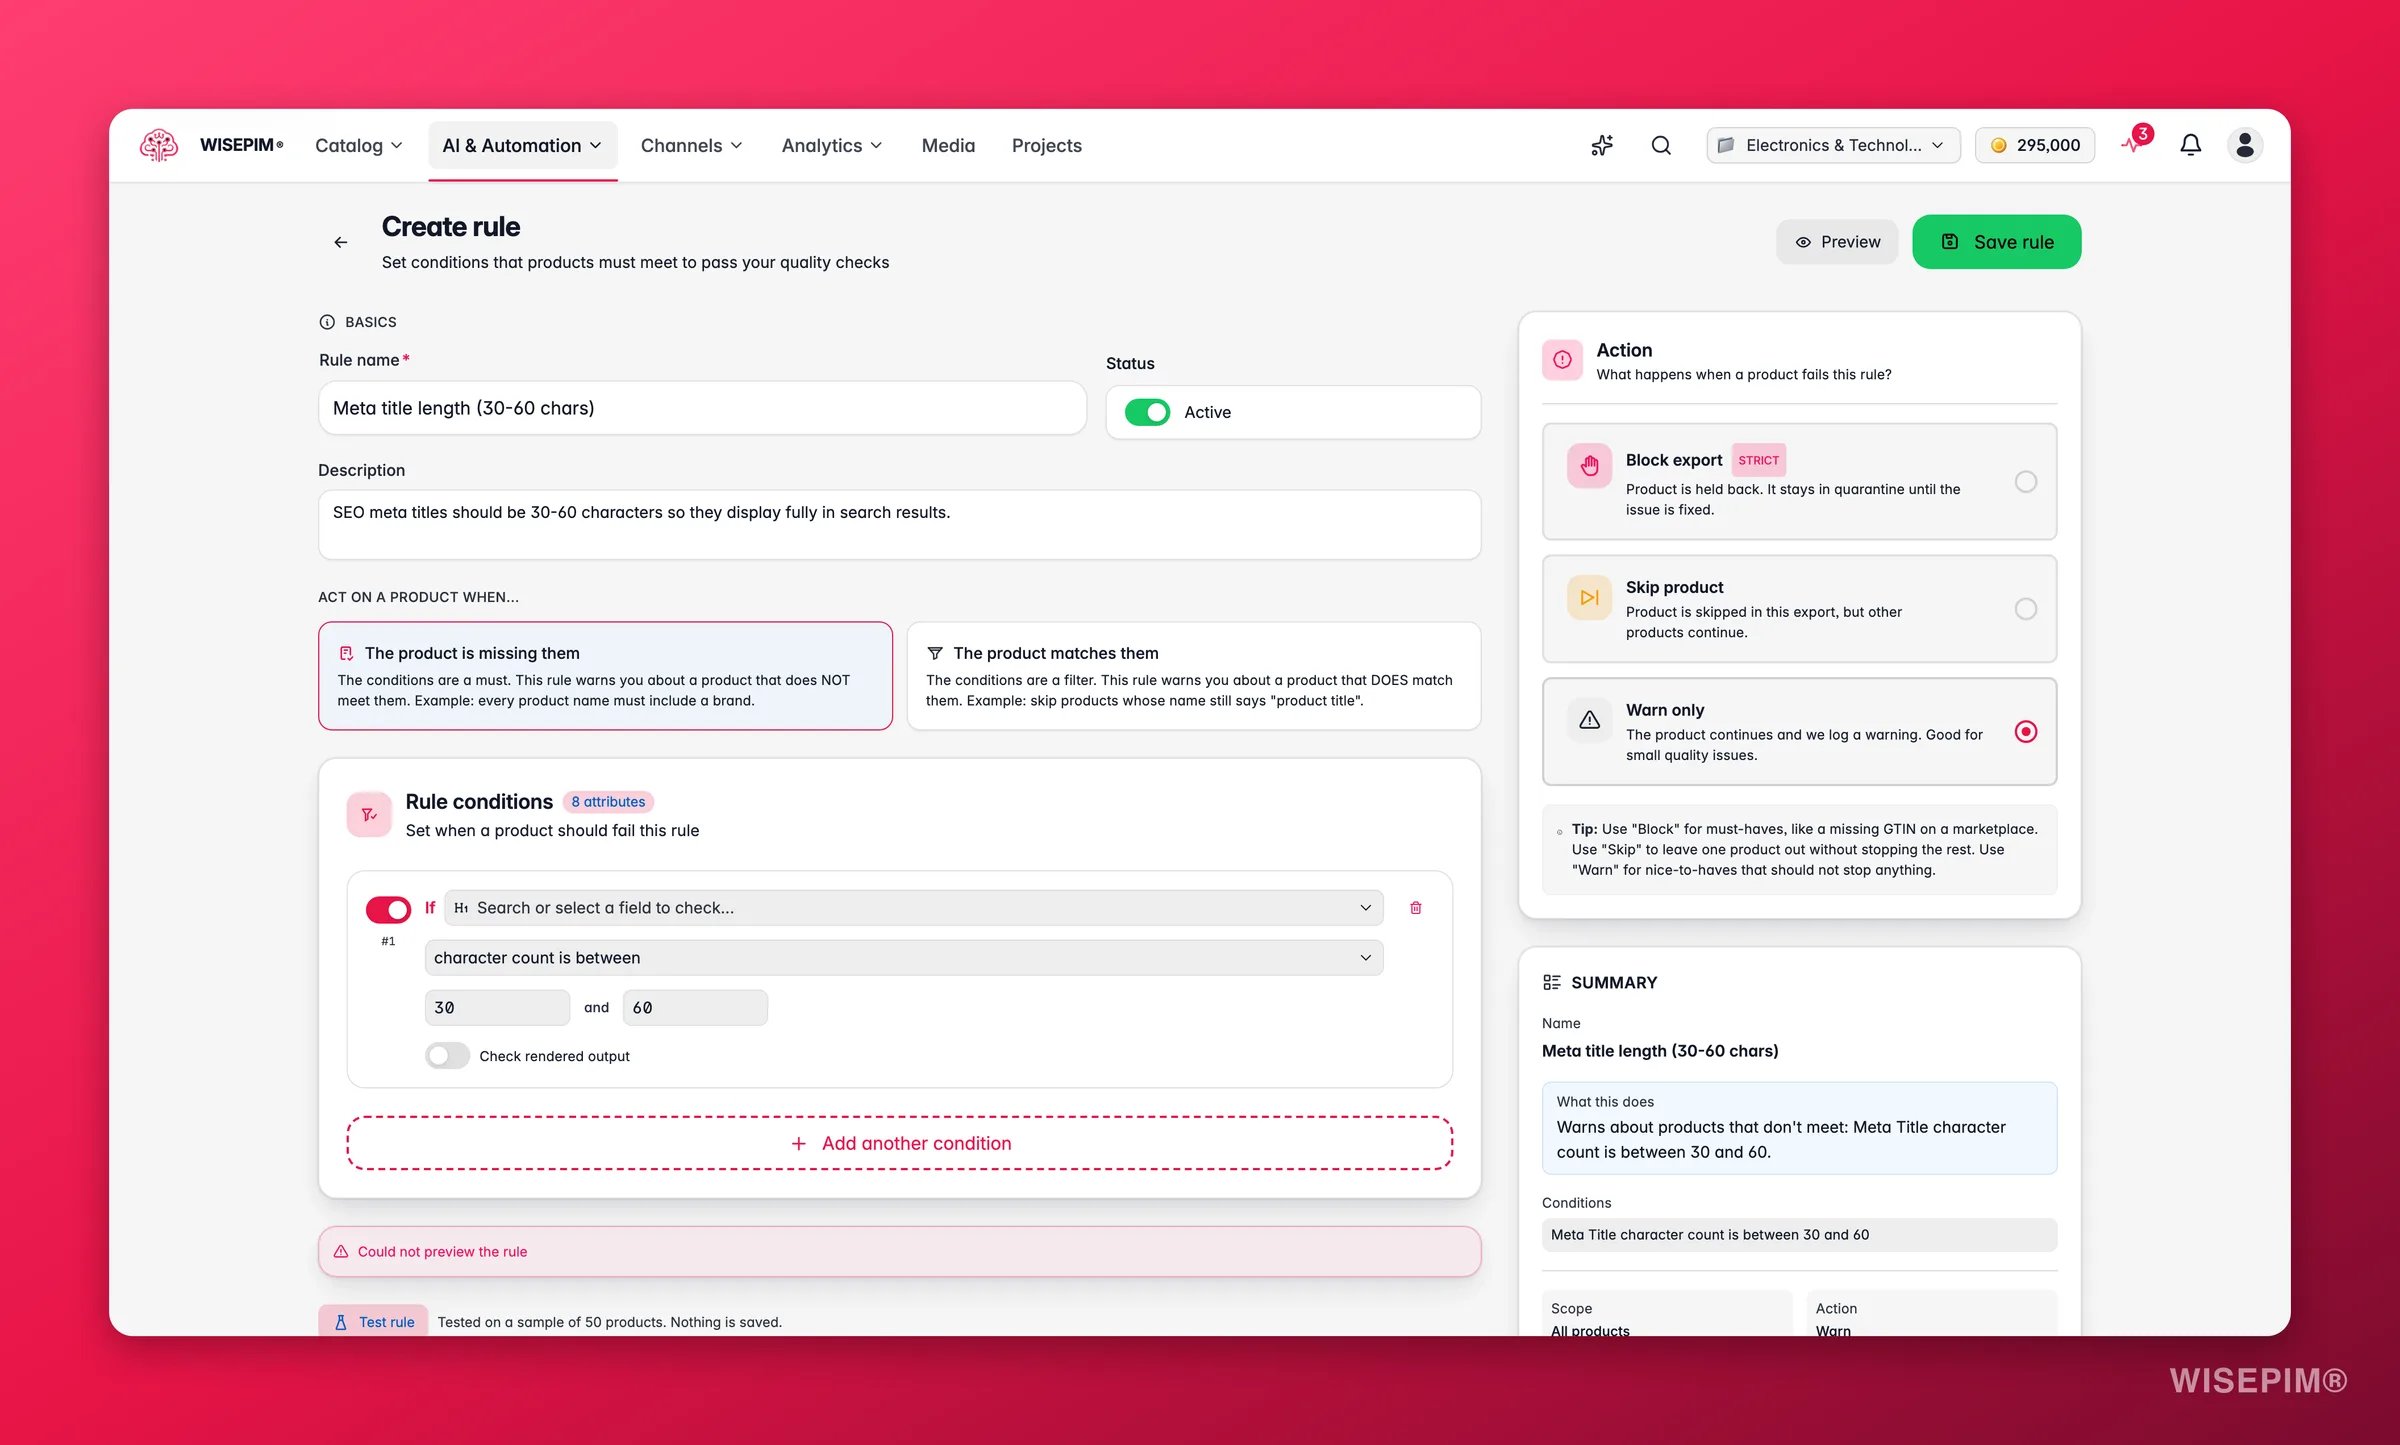
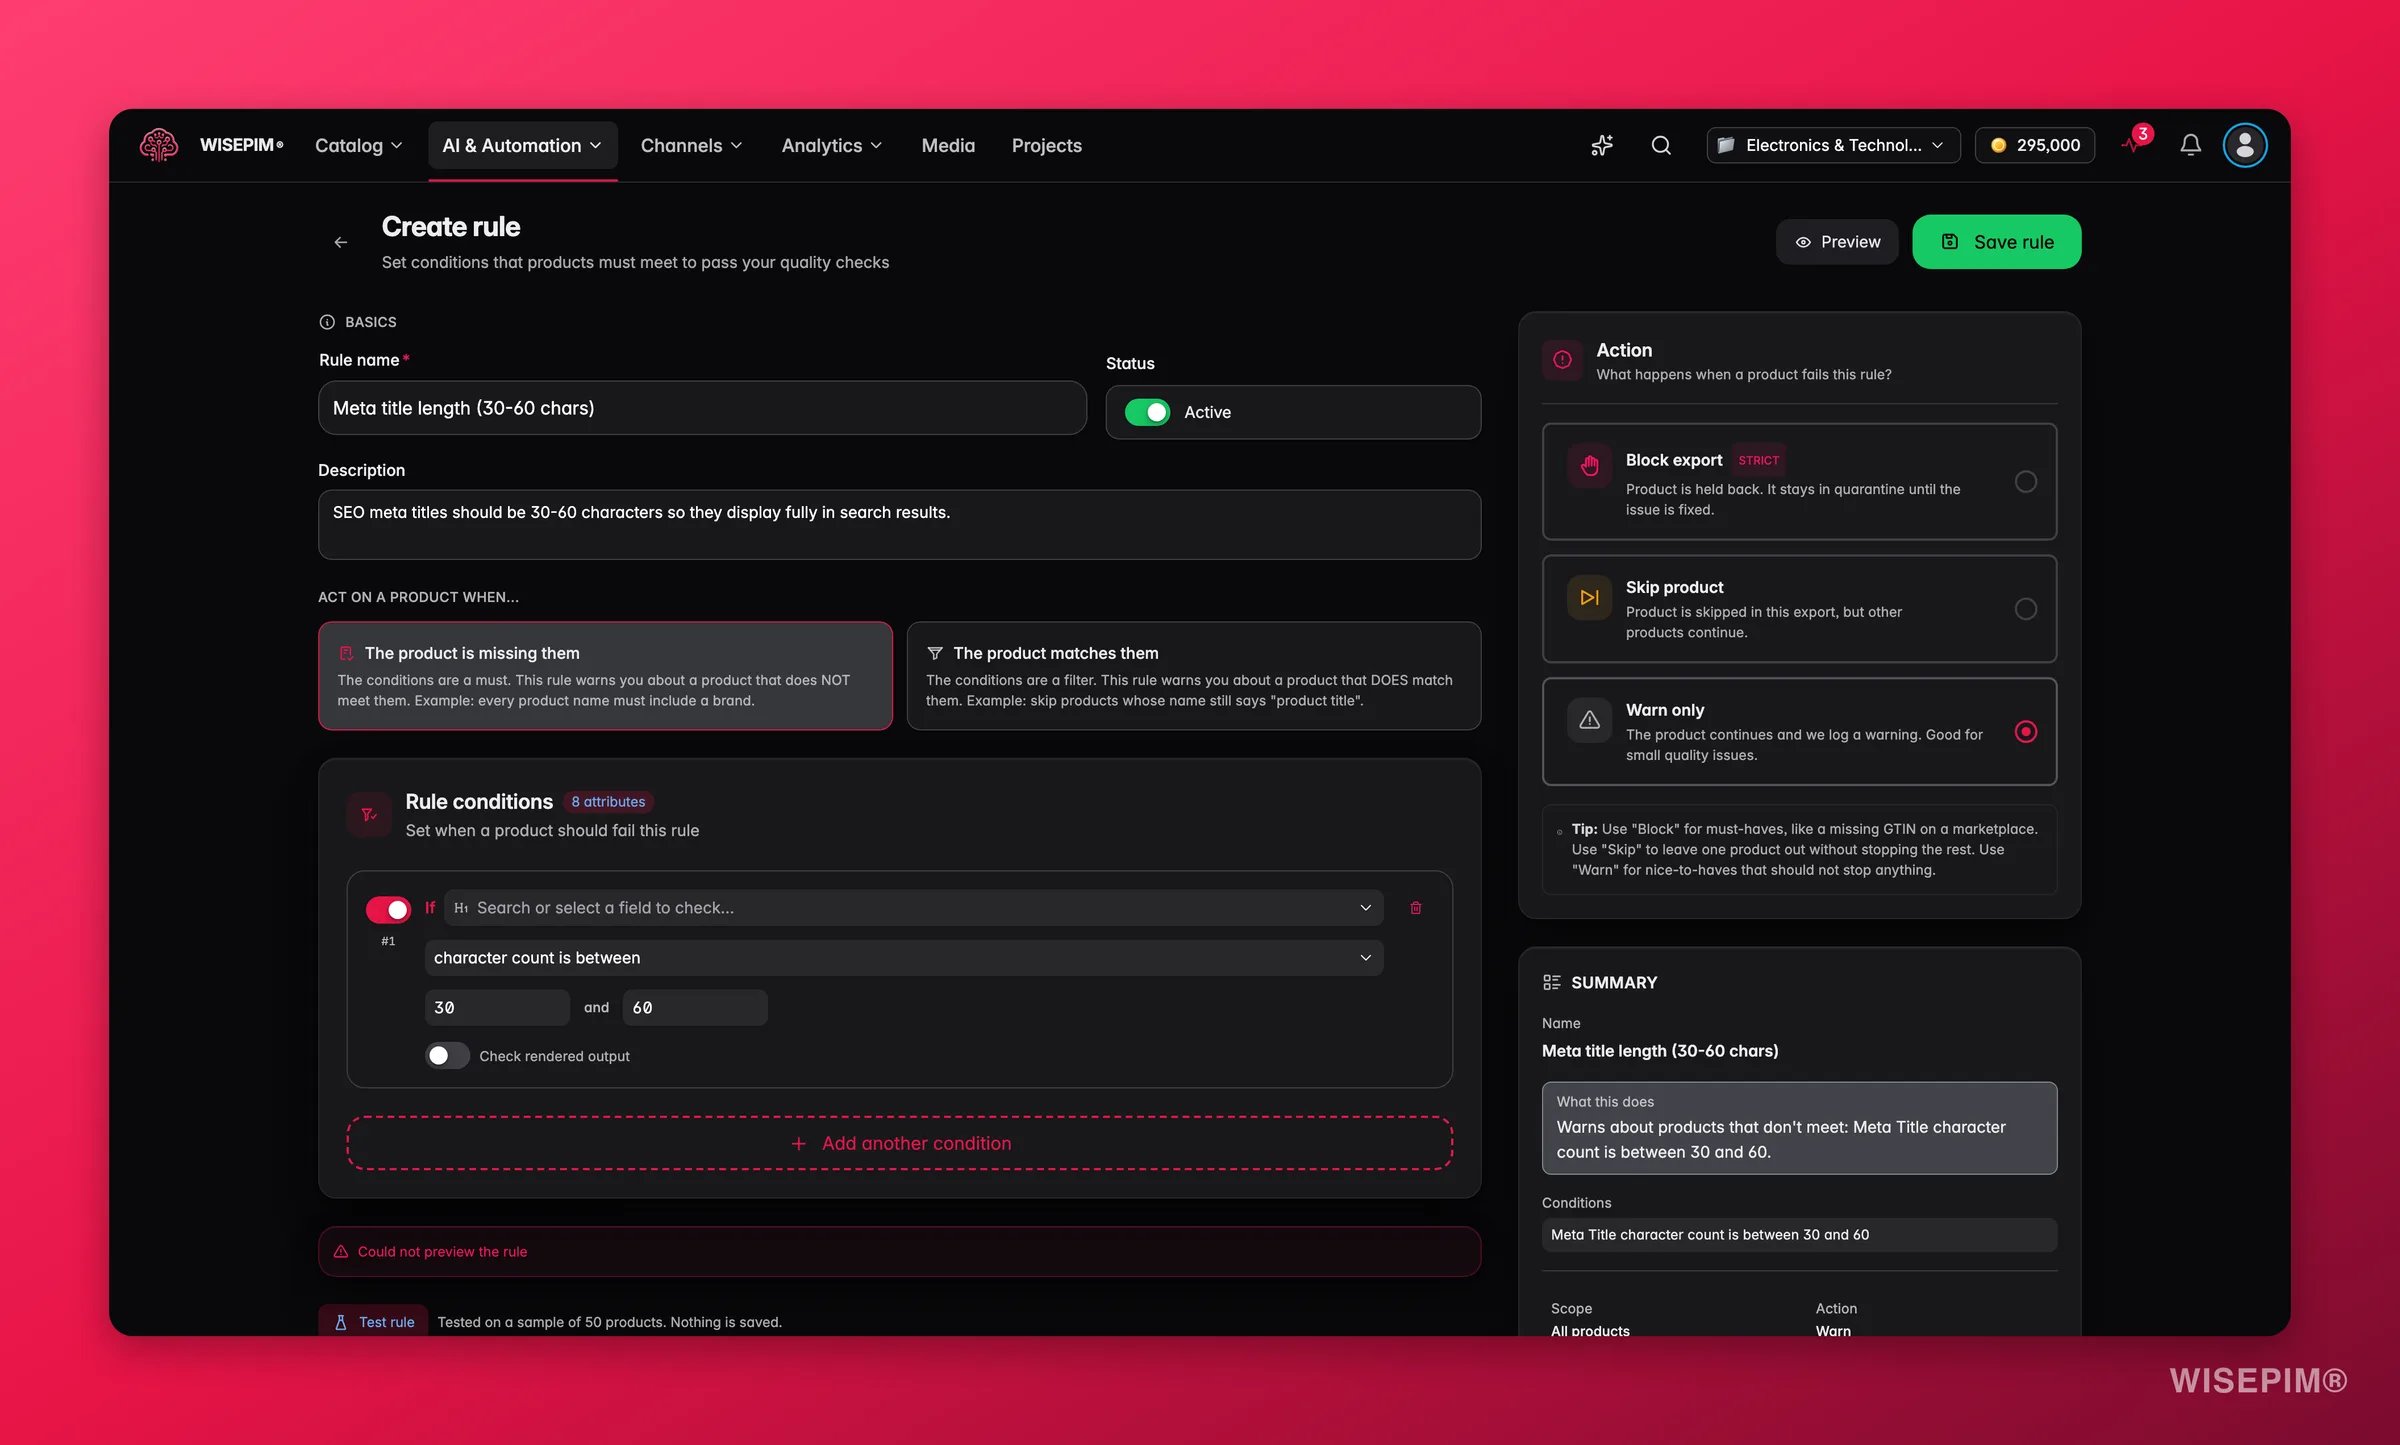
On the Rules page in Quality Guard, click Create Rule and build a minimum-content check covering whatever your target products were missing - a minimum description length, a required image count, a mandatory attribute. Numeric thresholds show a distribution hint with your catalog’s p10, median, and p90, plus a live impact preview of how many products would pass or fail, so you can pick a threshold your actual data can meet.
2
Start at Warn, not Block
Warn exports the product and logs the failure to the audit log; Block quarantines it until the issue is fixed. Run new rules at Warn until you have seen what they catch, then raise the severity once the count is sane.
3
Export the fixed content to your storefront
This is the step people forget, and it invalidates the whole measurement. Select the fixed products on the Products page and use Export in the toolbar. Platform exports run as background jobs and can take from a few minutes to a few hours depending on catalog size, so check the export reference before you assume it stalled.
4
Verify on the live site and note the date
Open two or three fixed products on your actual storefront and confirm the new content is there. Write down when that landed: your before-and-after is anchored to that date, not to the day you ran enrichment.
Returns move slowly, because each data point has to travel through an order, a delivery, and a return window before it reaches the chart. The catalog-side signals confirm the work landed; only the returns signals confirm it worked. Expect nothing from those for the first two weeks.
The quality-grade gradient is flat, so where do I even start?
A flat gradient means content is not your driver - good and bad products return alike. That points to fit, sizing, or expectation rather than missing information, and the Returns & Refunds report suggests size guides, compatibility information, and more realistic lifestyle images. It is a product-level conversation rather than an enrichment one.
Three weeks later and the return rate hasn't moved
Check that the fixed content actually reached the storefront. If Skip unchanged was on and the products were not detected as changed, the export may have sent nothing - turn it off to force a full re-export, as Exporting products describes. Confirm on the live site before you conclude the fix failed.
I have no return reasons at all
Some platforms only expose order-level refunds. Without item-level data you still get the return rate, refunded revenue, and the quality-grade gradient, which is enough to run this guide. You just lose the reason breakdown as a cross-check, so lean harder on the gradient.
Attribute extraction filled almost nothing
It only fills attributes that already exist in your structure, so a spec with no attribute on the product family has nowhere to land. Confirm the attribute exists on the family, then re-run. If the source text simply does not contain the spec, Web Research fetches it from external sources and you extract afterwards.
My new Quality Guard rule is quarantining half the catalog
Block severity quarantines everything that fails, and your threshold is above what your data can currently meet. Drop the severity back to Warn, use the distribution hint in the rule builder to pick a threshold near your catalog’s median, and raise it as the catalog improves.
Web Research came back empty for my worst products
Usually the identifier is wrong, unrecognized online, or the product is too new or niche to have public data. Try a different identifier type - if EAN returns nothing, Web Research suggests brand plus name, or the model number.