A review runs on demand and analyzes the products you choose. Vision dimensions (checking images against your data) use AI credits, so the cost scales with catalog size and the dimensions you pick. Results are queued and typically ready in a few minutes; they never expire, so you can revisit any past run.
Run a review
1
Open AI Quality Review
Find it in the Analytics sidebar under the quality section, or trigger it straight from a product selection in the Products table.
2
Choose what to review
Review your current selection or everything matching your active filters. Start small (one family or category) if you just want a read on a specific area.
3
Pick an intent preset
Prelaunch (all text dimensions), SEO, Image (turns on vision), or Conversion. Each preset selects the dimensions that matter for that goal. Custom lets you choose dimensions yourself.
4
Add optional context
Set an industry for vertical-specific expectations, add up to three buyer personas to simulate how different shoppers react, or add a freeform instruction for anything specific you care about.
5
Run and review
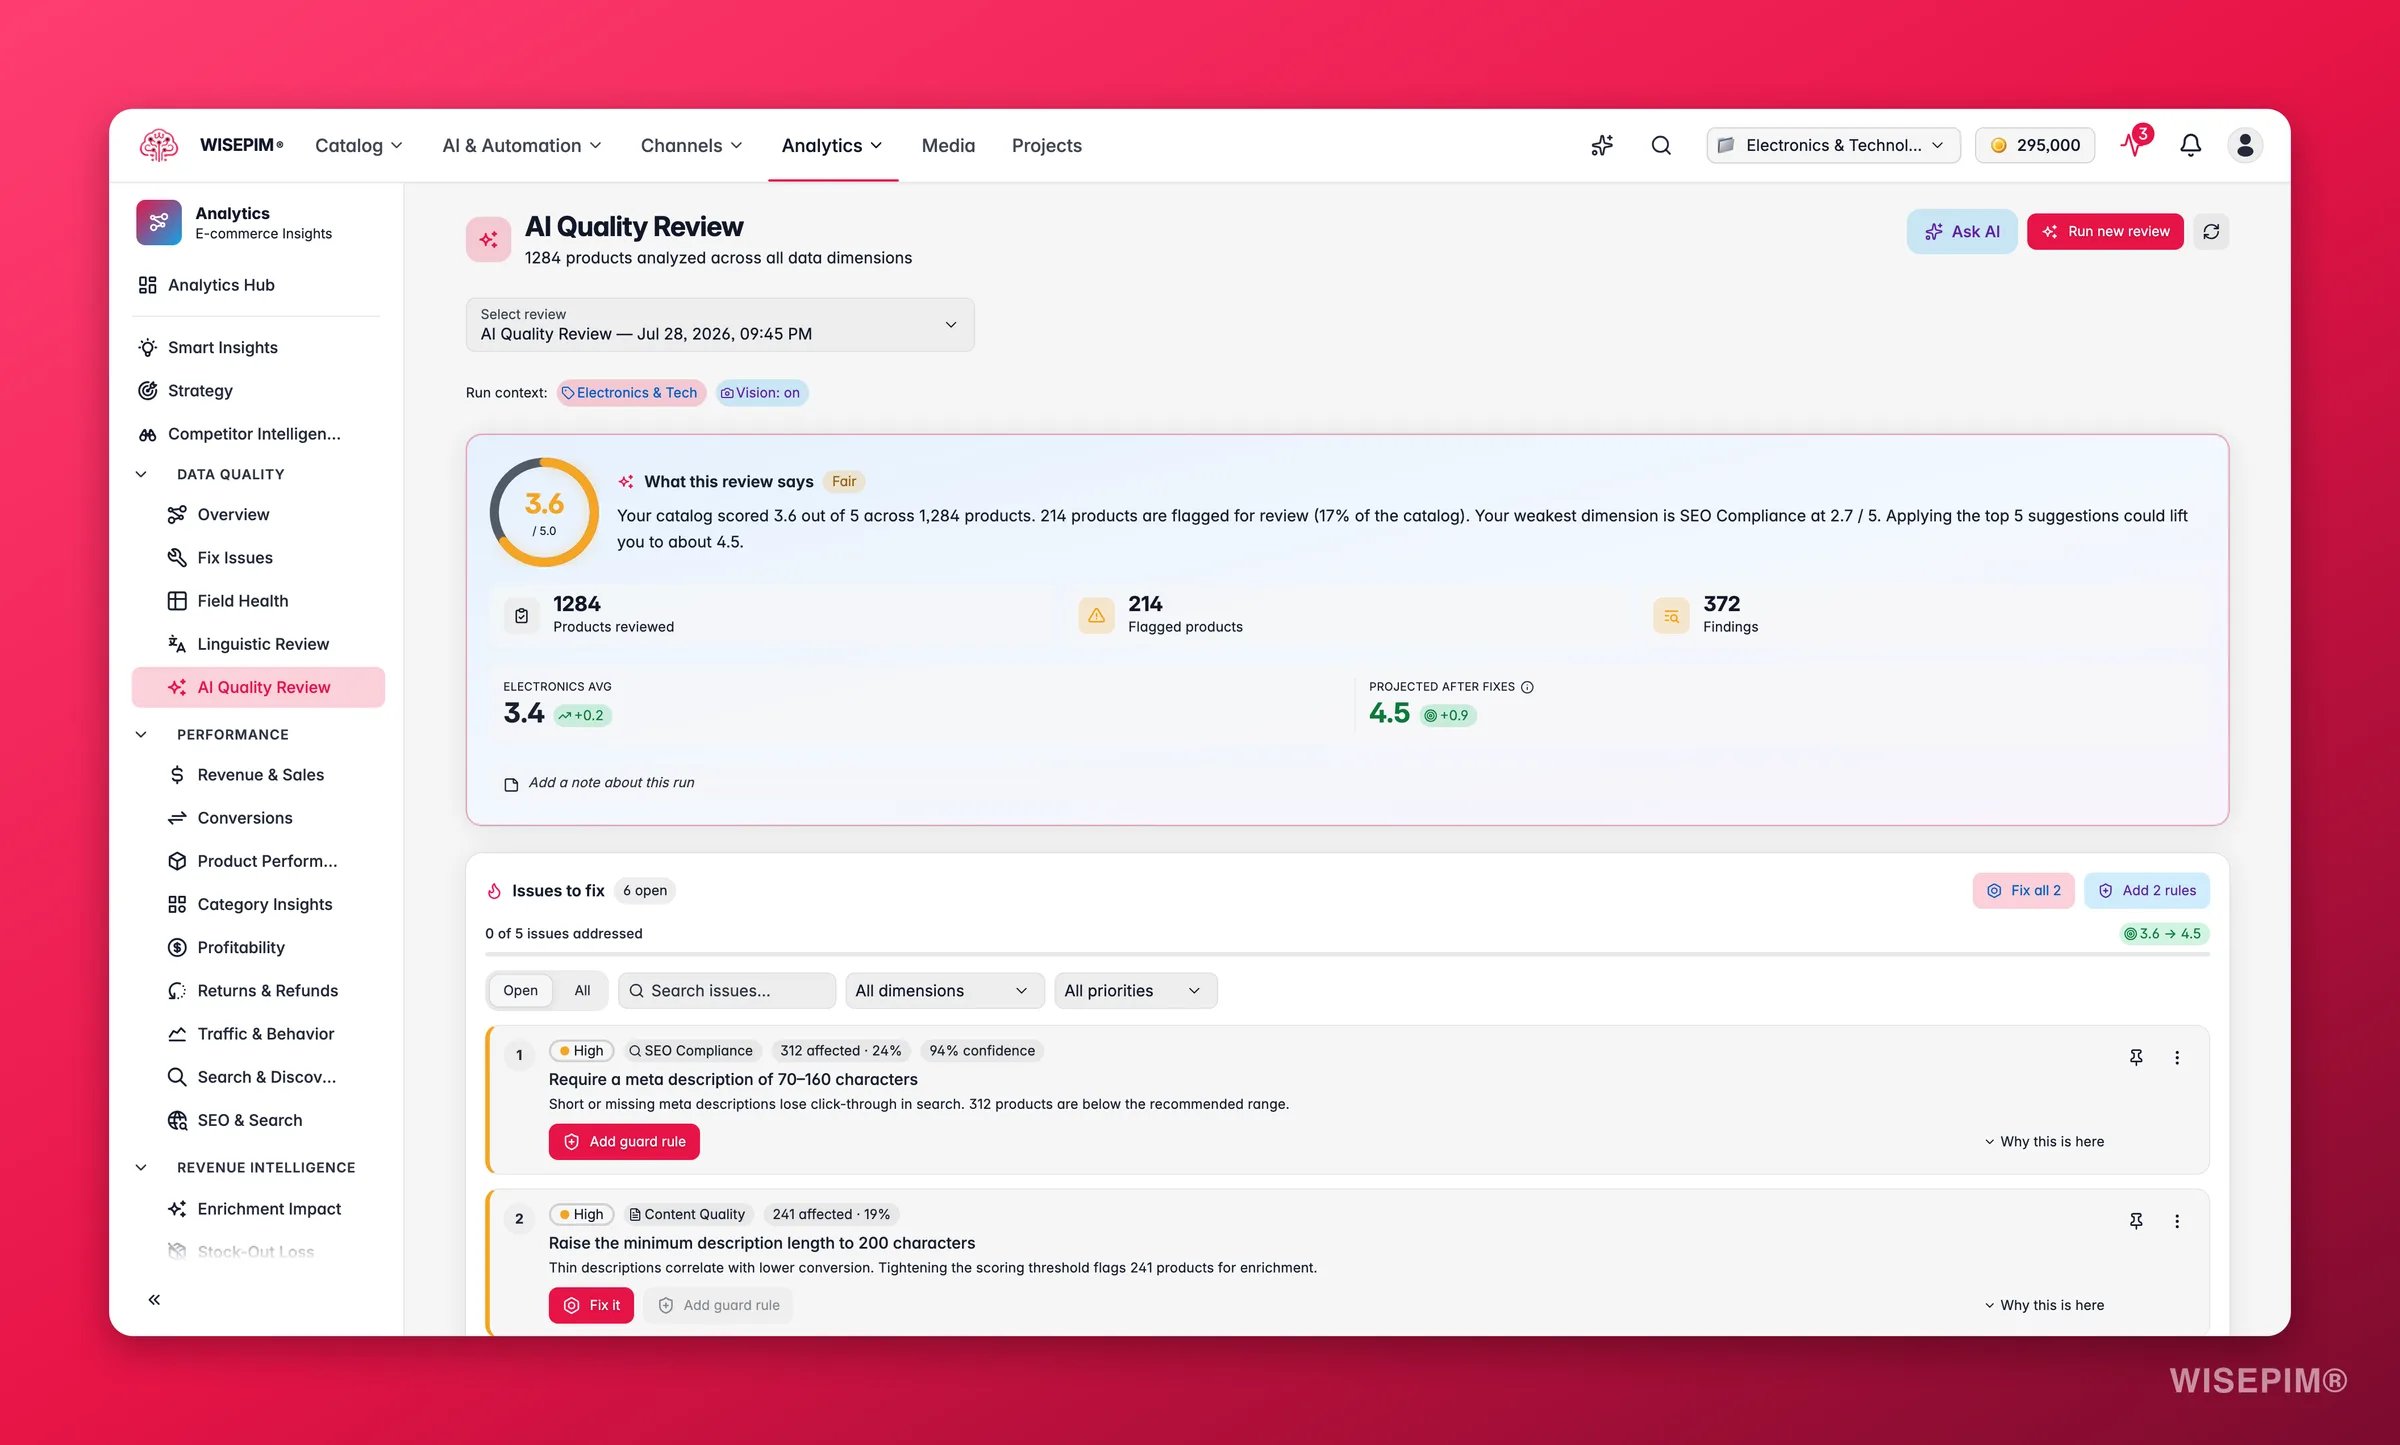
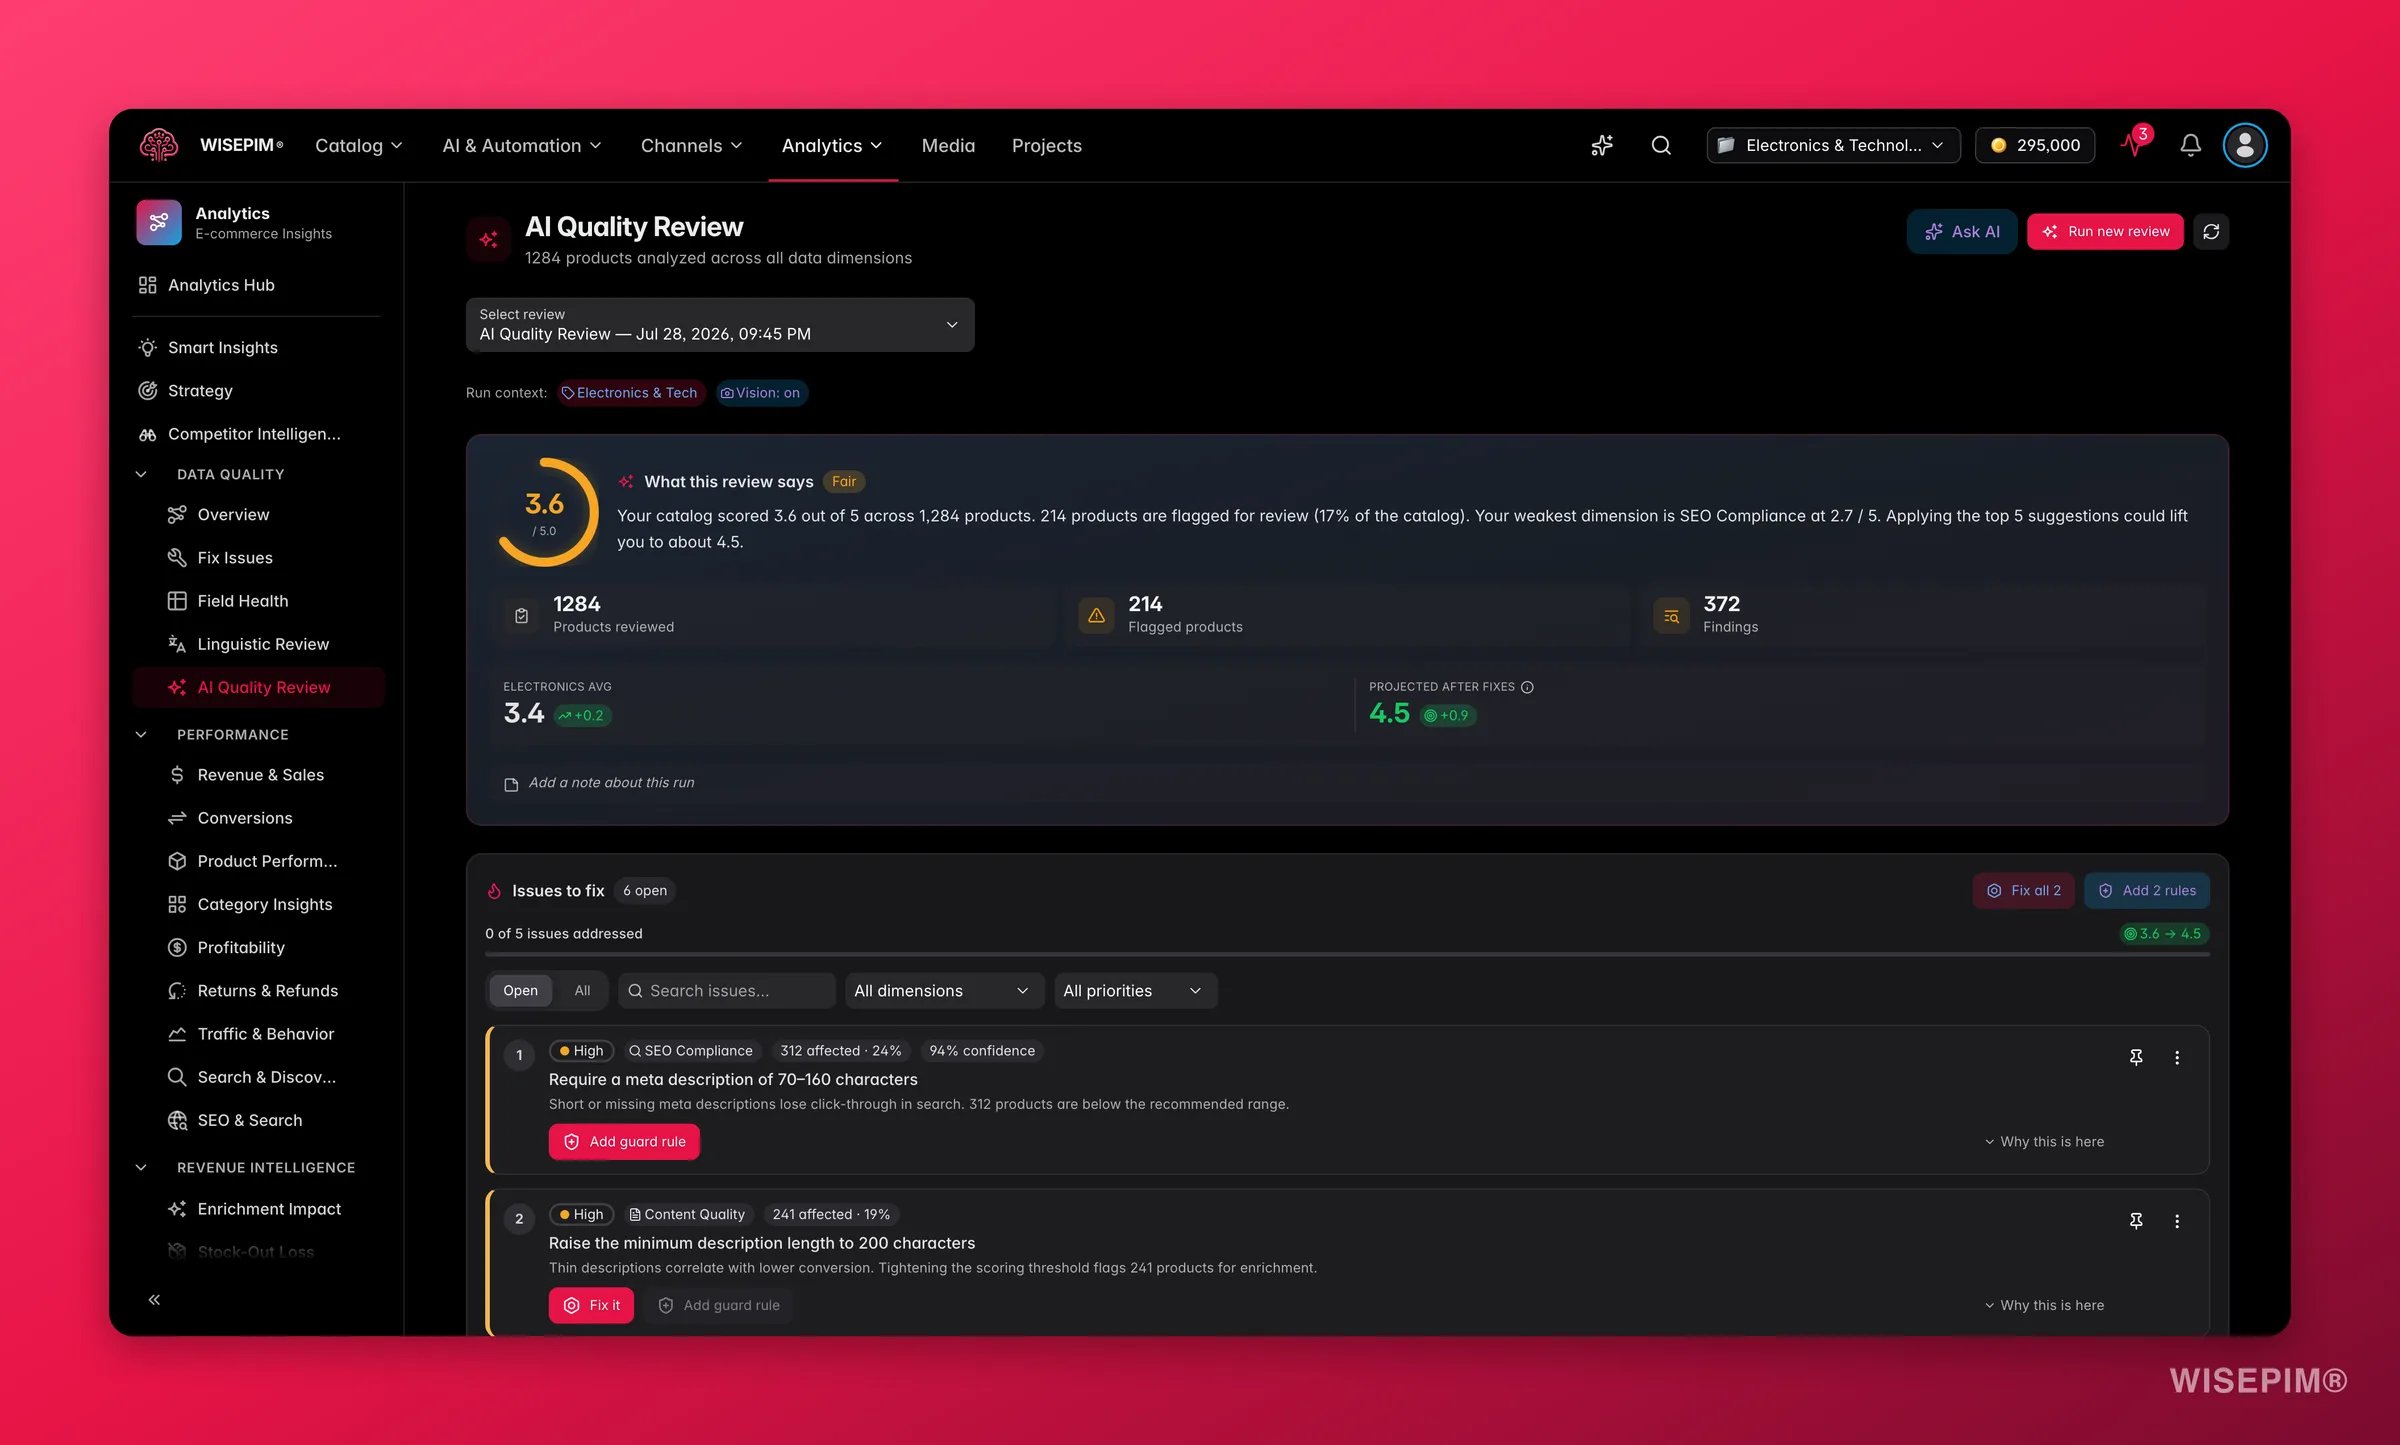
The review processes in the background. When it finishes, the dashboard fills with your score, the dimension breakdown, and a prioritized list of issues to act on.
The 12 dimensions
Each product is scored on these dimensions. The two image dimensions require vision and use additional AI credits.What the scores mean
Each product also gets a priority (Critical, High, Medium, Low) from its overall score, so you always know where to start. The dashboard compares your overall score against an industry benchmark and projects the score you would reach if you applied the open suggestions.
Reading the results
- The dimension radar shows your shape at a glance. One spoke pulled toward the center is the dimension to fix first.
- The Issues to fix list is the heart of the page: every issue is ranked by how many products it touches and how severe it is, with a plain-language title and the affected count.
- Confidence and consensus chips tell you how sure the AI is. A suggestion flagged for review (consensus dissent) shipped anyway but deserves a human glance before you apply it in bulk.
- The Insights tabs add depth: priority breakdown, score trends across past runs, a conversion-readiness checklist, buyer-persona findings, and open-ended observations the AI surfaced outside the fixed dimensions.
- The per-product findings table lets you drill into any single product to see its per-dimension scores and the exact findings behind them.
Fix it, or guard against it
- Fix applies the suggestion now. Depending on the issue that might create a Quality Guard rule, adjust a scoring setting, add a missing attribute to a family, or fill a value the AI derived from an image.
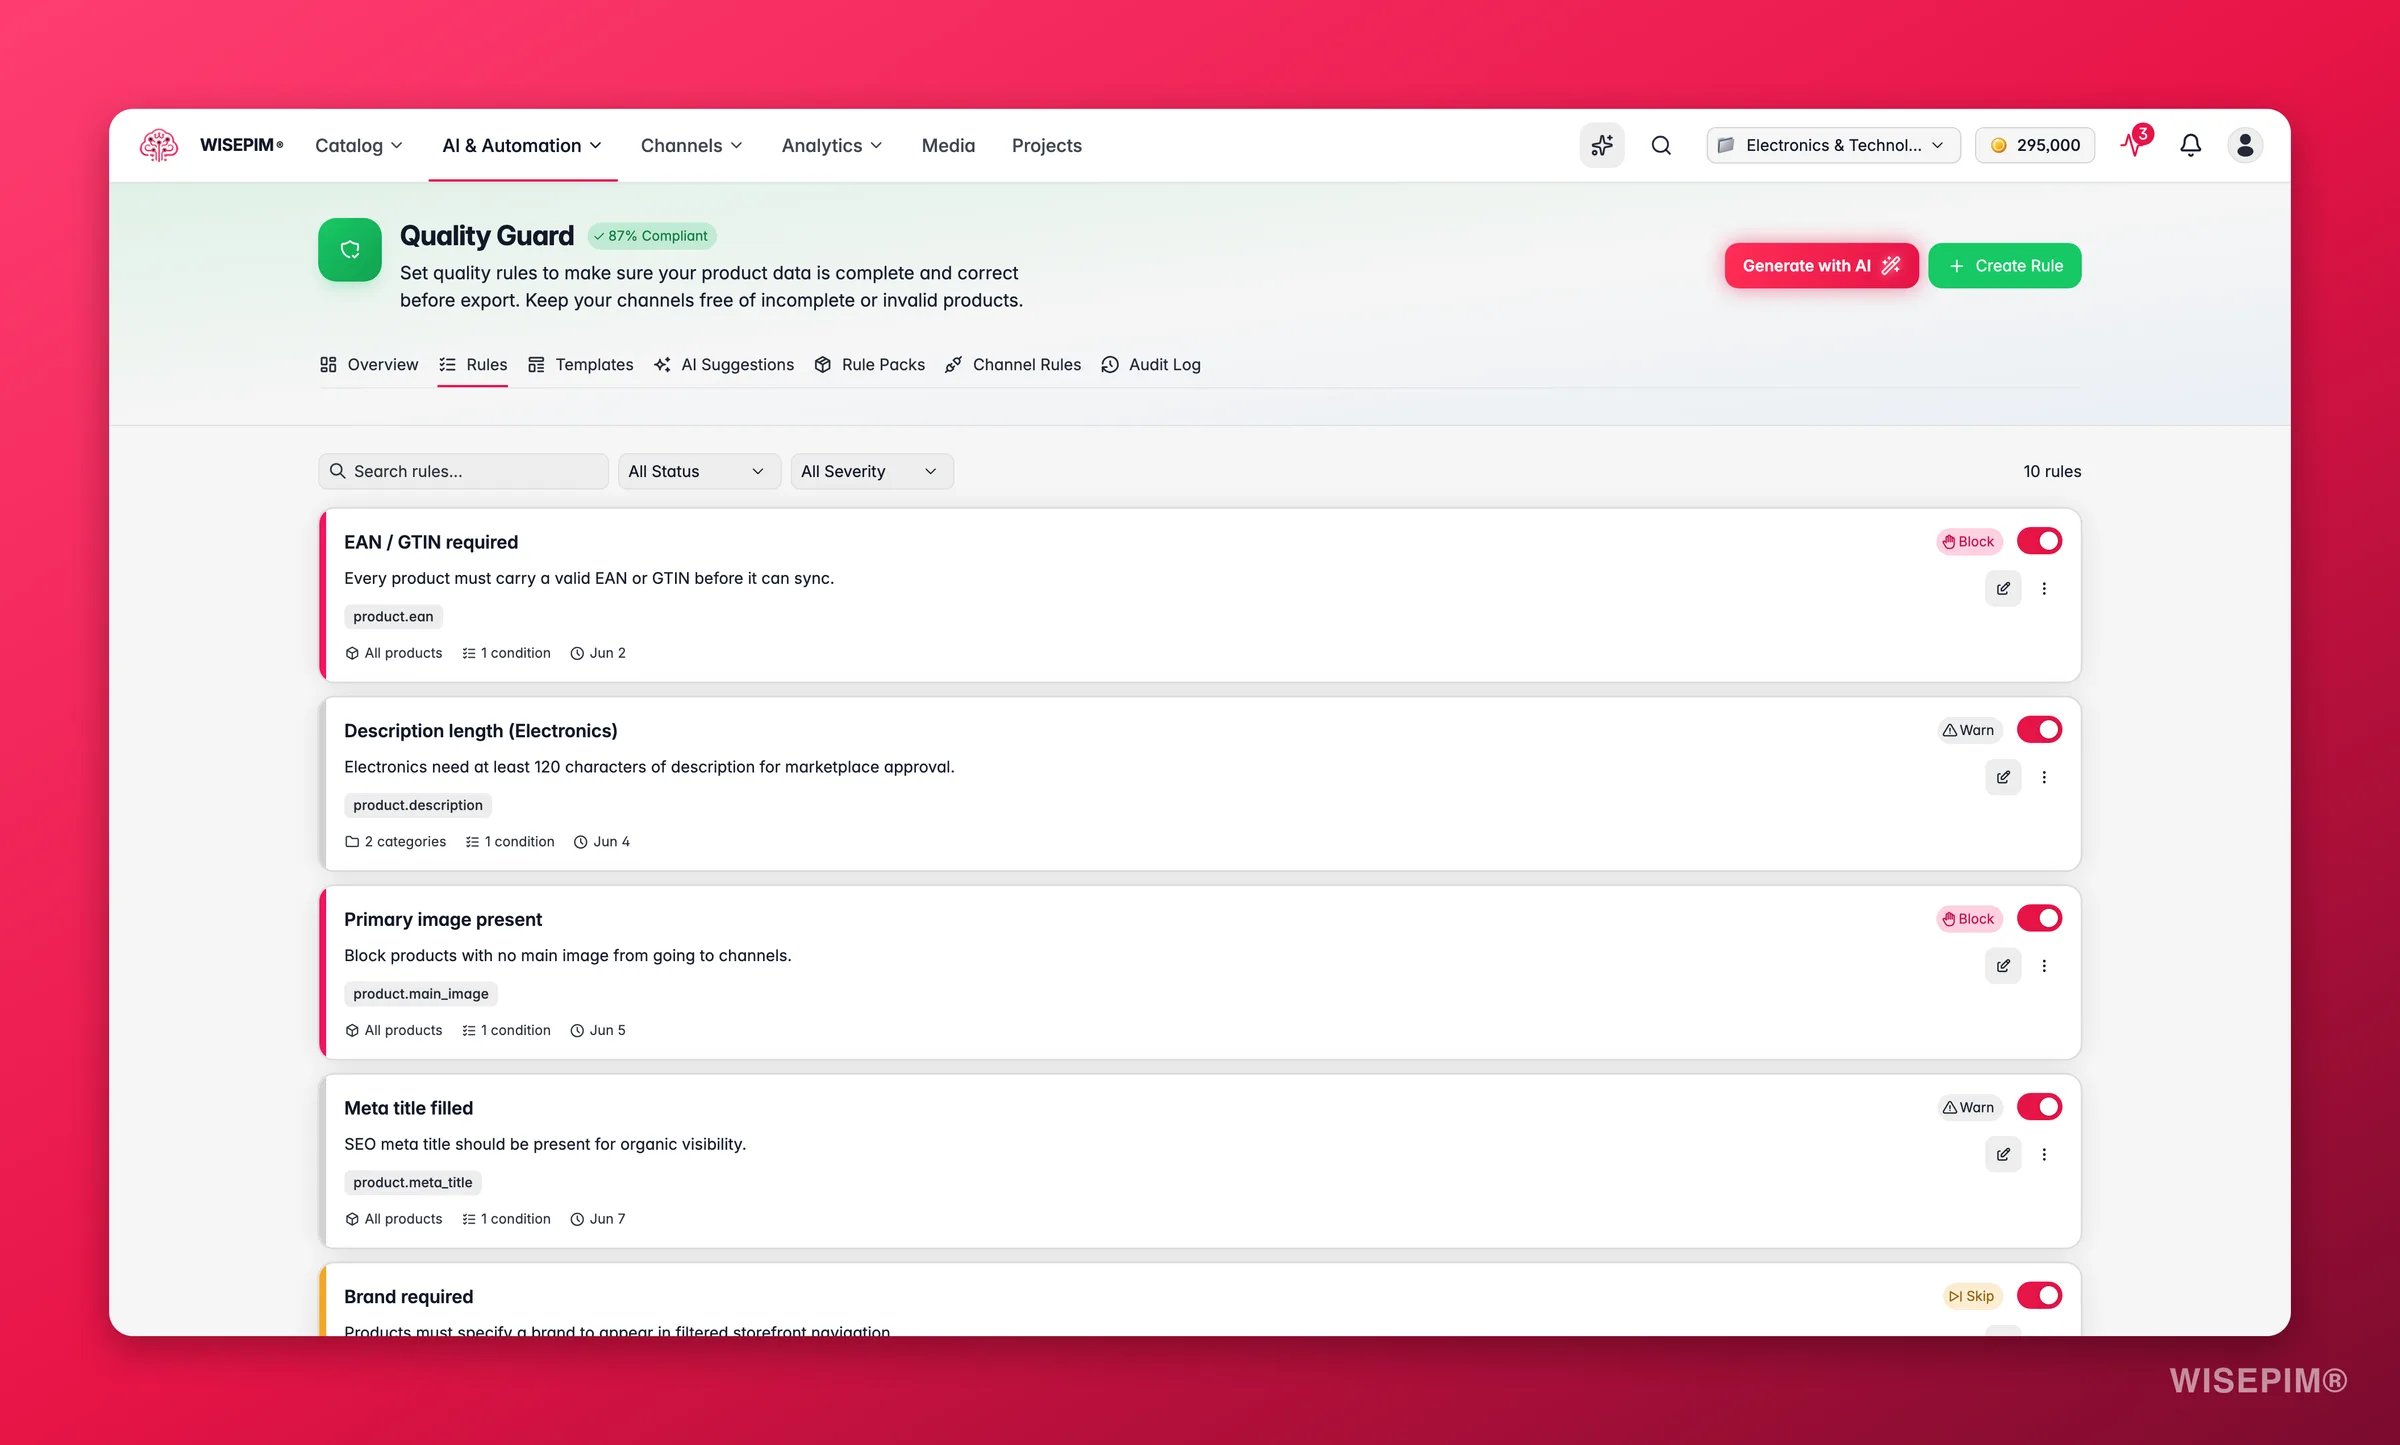
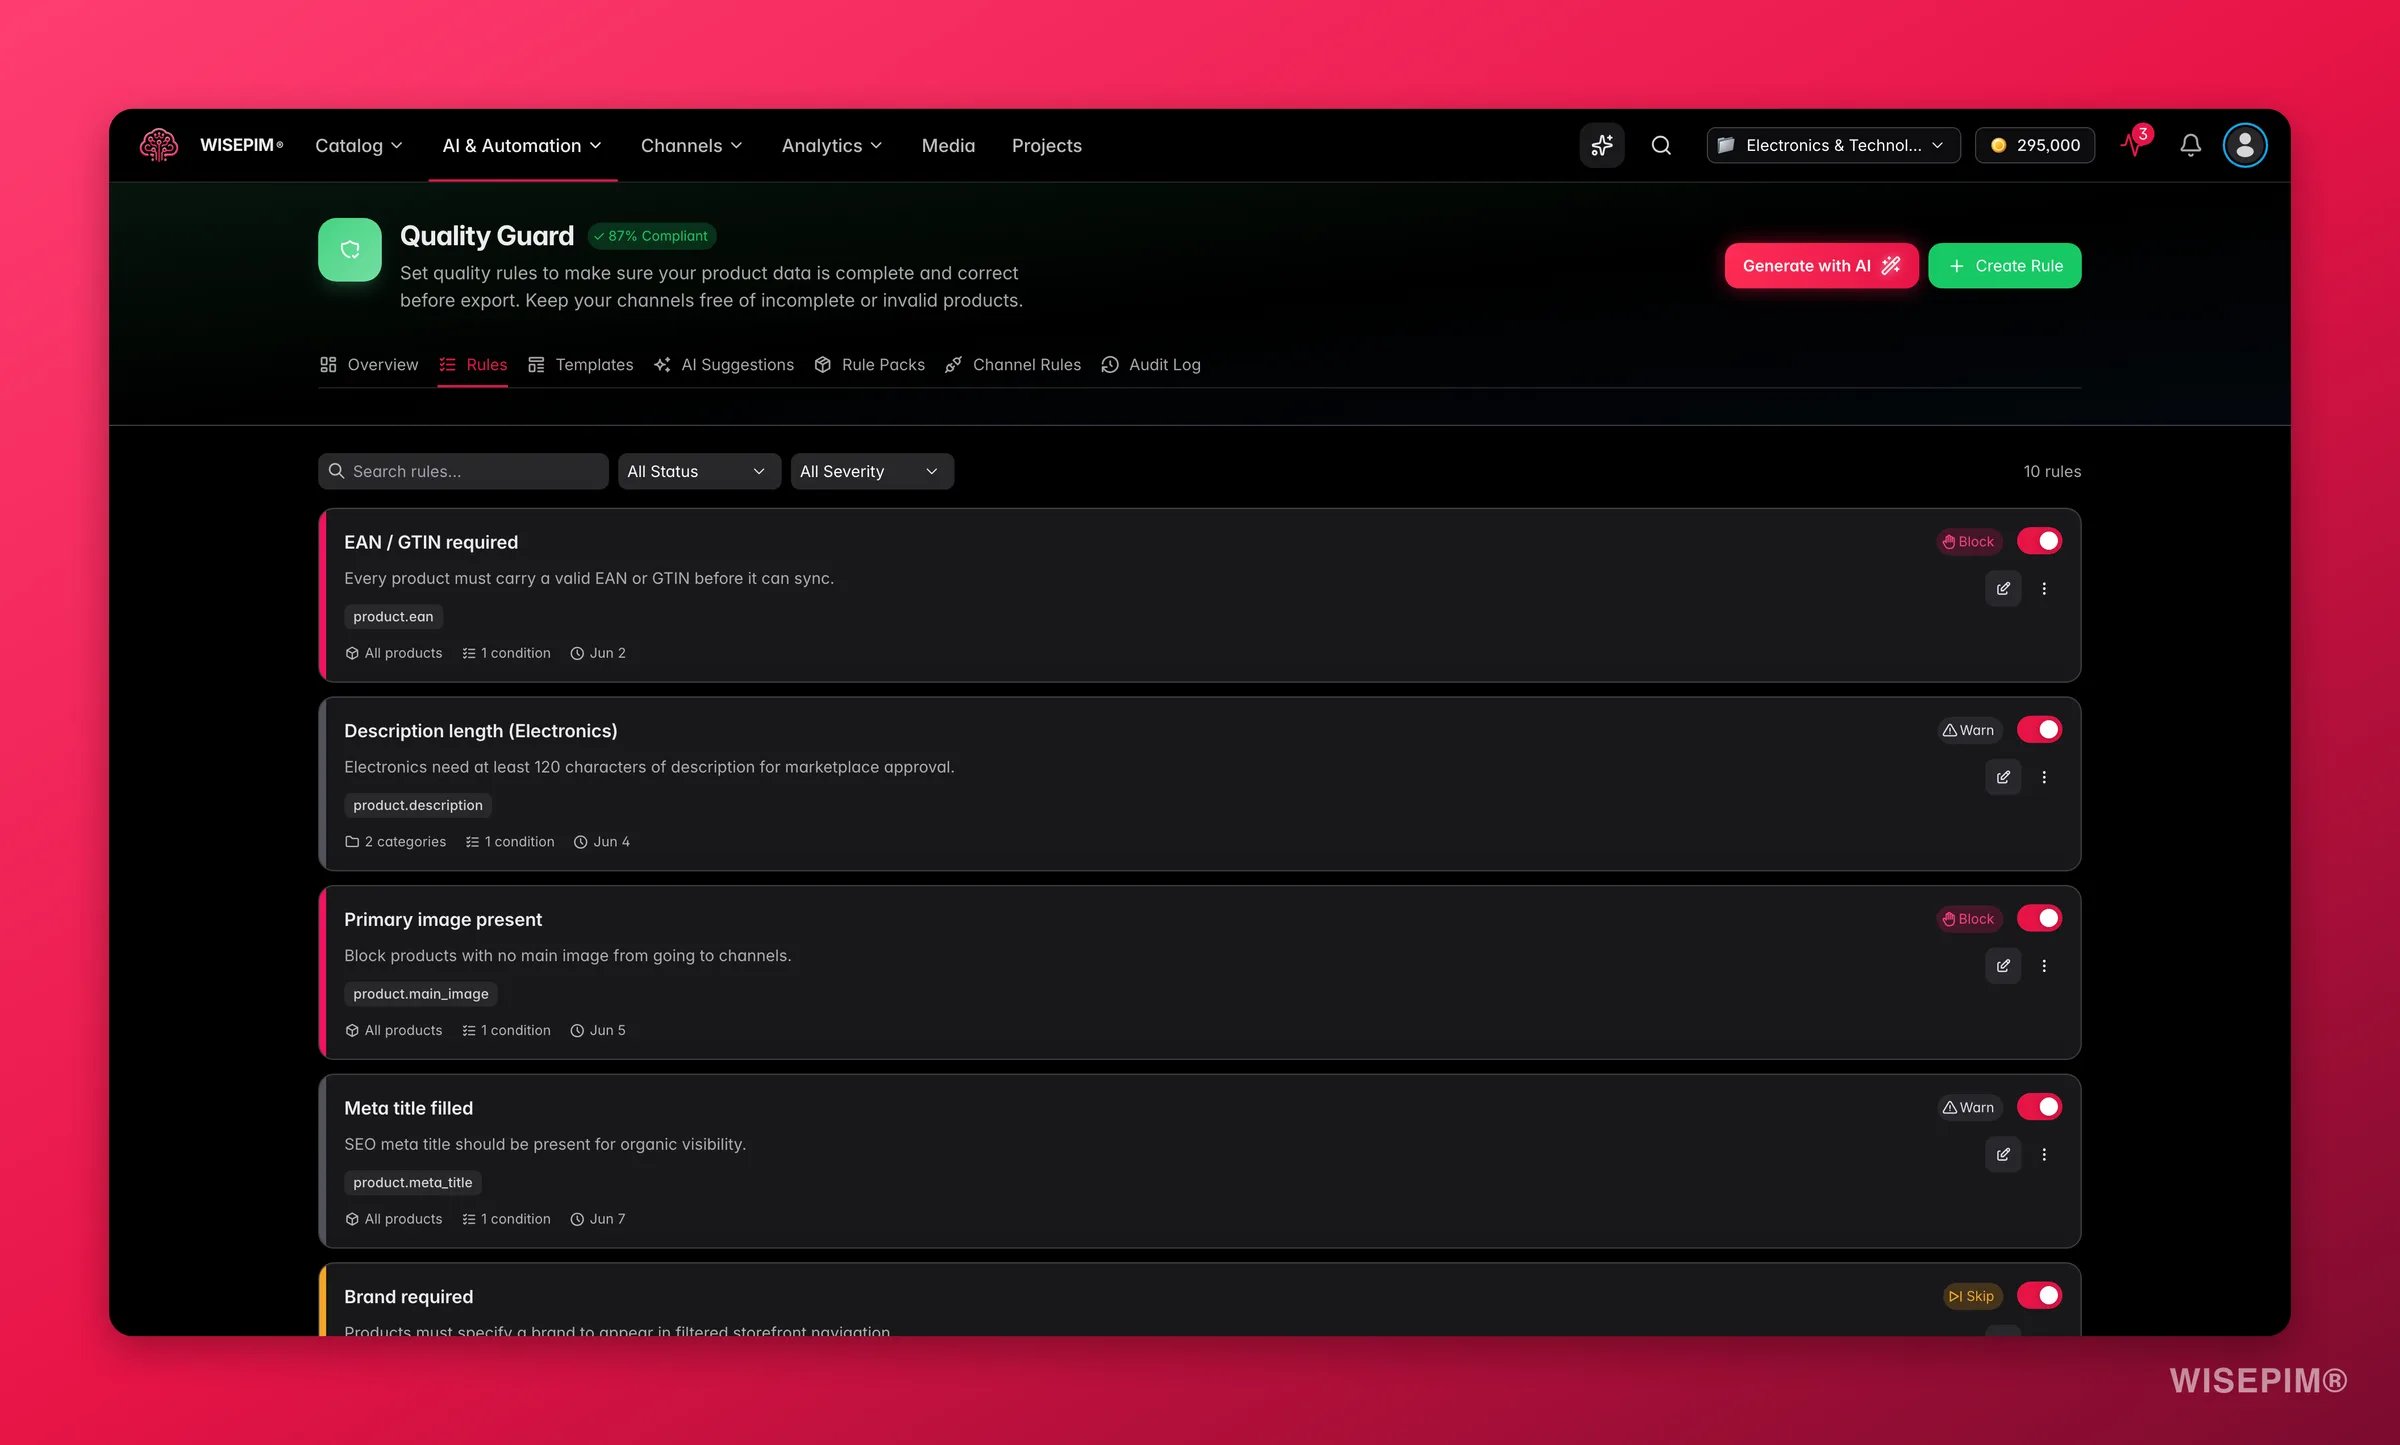
- Add guard rule creates a Quality Guard rule (left inactive for you to review and enable) so the same issue is caught automatically on every future import and edit.
Act on what you find
Your overall score is below 3
Your overall score is below 3
Open the dimension radar and find the lowest spoke, then filter the Issues list to that dimension and work top-down by affected count. Apply the highest-impact fixes first and watch the projected score climb. Outcome: the fastest possible lift, because you are fixing the issues that touch the most products.
One dimension is dragging the whole score down
One dimension is dragging the whole score down
A single weak dimension (often SEO Compliance or Attribute Coverage) is usually one systemic gap, not a thousand unique problems. Apply the matching suggestion (for example, raising the minimum description length or adding a missing attribute to a family) to fix it across the catalog at once. Outcome: a broad quality jump from a single action.
The same issue keeps coming back across runs
The same issue keeps coming back across runs
Recurring issues are a data-discipline problem, not a one-off. Use Add guard rule to create a Quality Guard rule that blocks it at import and edit time, then enable it. Outcome: the issue stops reappearing, so each future review starts from a cleaner baseline.
A suggestion is flagged for review
A suggestion is flagged for review
When the consensus pass disagrees with itself, the suggestion still ships but is flagged. Open the affected products and confirm before applying in bulk. These are the cases where AI is least certain and a human eye pays off most. Outcome: you keep the speed of automation without applying a wrong fix at scale.
Vision found image and data mismatches
Vision found image and data mismatches
Image-vs-data findings (a red product photographed in blue, three items shown for a single-unit listing) are common after supplier imports. Fix the attribute or the image, or fill the AI-derived value where it is confident. Outcome: images and data finally agree, which reduces returns and channel rejections.
Conversion Readiness is low
Conversion Readiness is low
The Conversion Readiness tab lists the signals buyers expect for your vertical (size charts, what’s-in-box, certifications) and how many products are missing each. Add the missing attributes, starting with the signals marked critical. Outcome: listings carry the information that turns a browse into a purchase.
How it relates to the other quality tools
- Data Quality is the always-on, rule-based health monitor: it tells you what is missing. AI Quality Review is the improvement engine on top: it tells you what is wrong or weak and how to fix it.
- Quality Guard is the enforcement layer. AI Quality Review discovers the rules worth having; Quality Guard keeps them enforced.
- Linguistic Review is the language-quality counterpart, focused on translation quality rather than product data.
Related
Data Quality
The rule-based completeness score that runs continuously across your catalog.
Quality Guard
Turn review findings into rules that block bad data before it lands.
Linguistic Review
The same idea applied to translation quality across your locales.
Enriching Products
Fix the content the review flags with targeted AI enrichment.