

This report needs order history with customer identifiers from your connected platforms. Anonymous and guest checkouts without an email address cannot be tracked across repeat purchases.
Key metrics
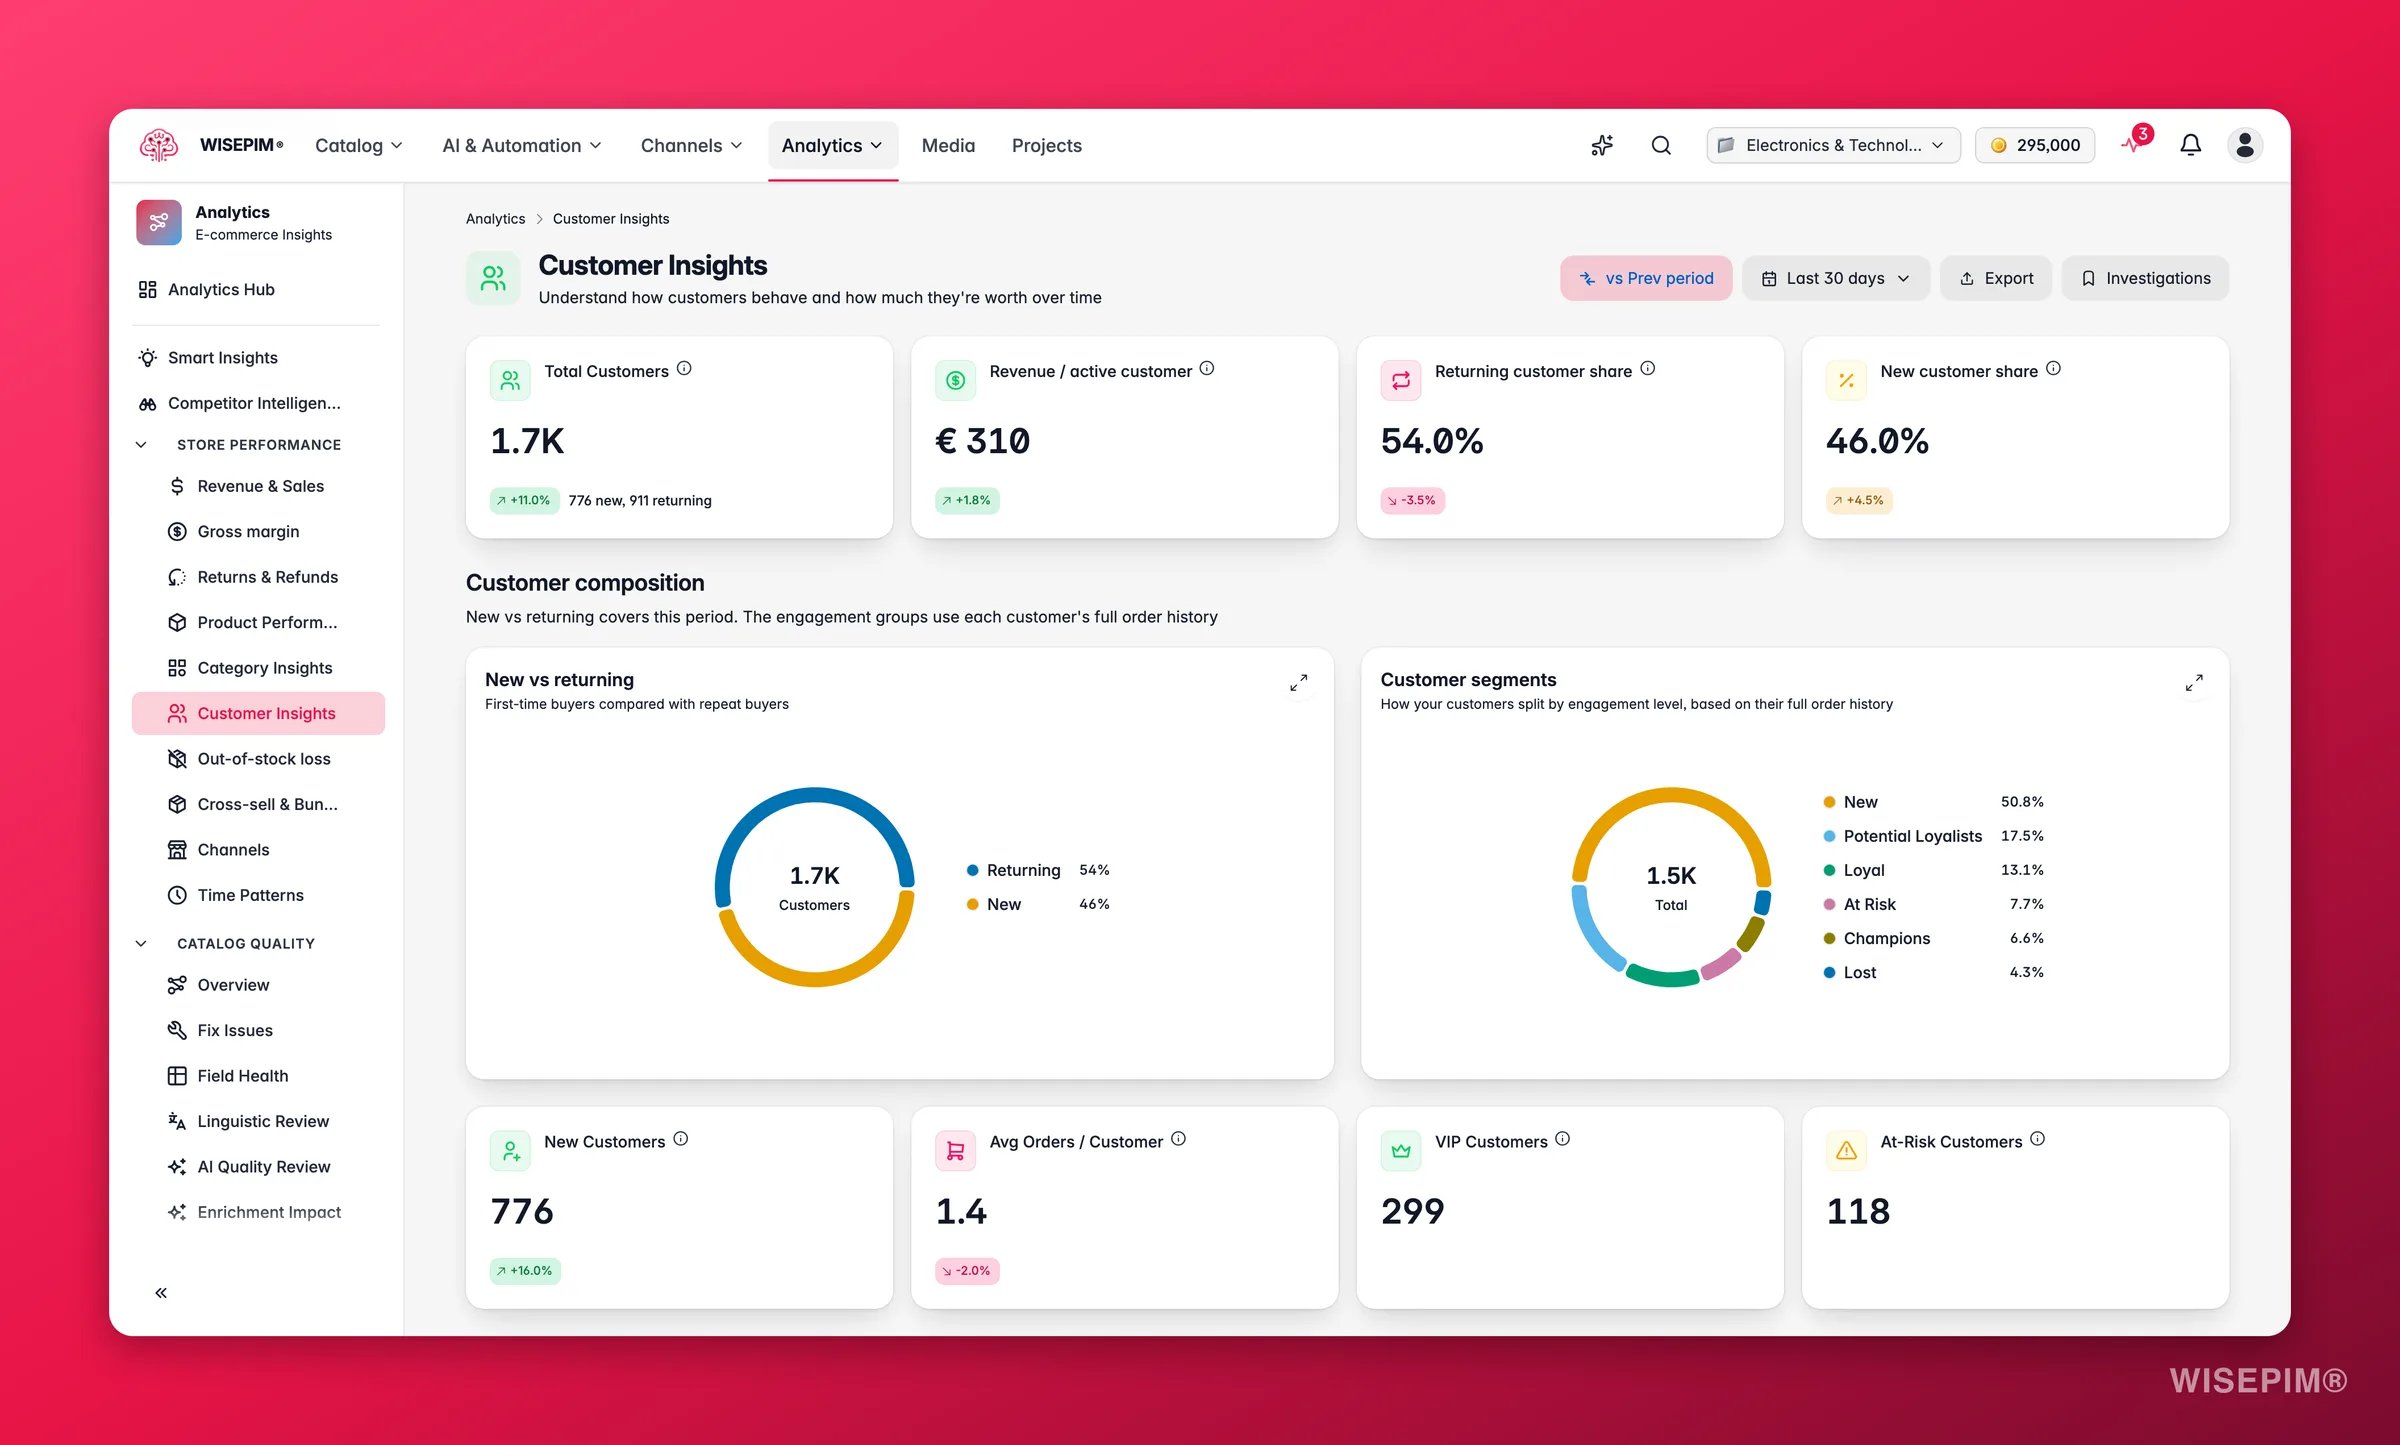
A secondary KPI row surfaces four more signals that are easy to miss in the headline numbers:
- New customers: first-time buyers gained during the period. A healthy business keeps this growing.
- Avg orders per customer: how many times the average customer buys. Low numbers signal a one-and-done problem.
- VIP customers: customers in the Champions and Loyal segments combined. This is the group most worth protecting.
- At-risk customers: customers who bought before but show signs of lapsing. An early-warning number for churn.
Composition
Two donuts sit side by side and answer different questions about who your customers are. The new vs returning donut shows the balance between first-time buyers and repeat purchasers in the selected period. A healthy store typically sees a mix that leans returning, it costs far less to keep a customer than to acquire one. The segments donut groups your customers into named RFM segments based on how recently they bought, how often, and how much they spend. Each slice is a distinct behavioural cohort:
The size of each slice shows where your base currently sits and whether it is shifting in a healthy direction over time.
Customer growth chart
A line chart tracks total and new customers over time. Steady new-customer growth means healthy acquisition. A flat or falling line means you need wider reach or new channels.Cohort analysis
The cohort section looks at groups of customers acquired in the same period and follows them forward.- Acquisition cohorts (stacked bar): each bar represents a cohort of customers who made their first purchase in a given month. The height shows the initial cohort size. Stacking lets you compare how large each intake was relative to others and how your acquisition volume has changed over time.
- LTV by cohort (line chart): each line follows one cohort’s cumulative revenue per customer as the cohort ages. Cohorts whose lines climb steeply are your best vintages. Cohorts that plateau early tend to be one-time buyers. Use this view to spot whether recent acquisition cohorts are tracking as well as older ones.
Segment performance table and top customers
A segment performance table lets you compare cohorts side by side. For each named segment it shows customer count, share of total customers, average order value, and revenue share. Use it to see how Champions differ from Promising customers in concrete revenue terms. A top customers table lists your ten highest-spending customers with their email address, total number of orders, and total amount spent. Use it as a quick starting point for VIP outreach or retention offers.Benchmarks
Use these ranges to judge where your metrics stand.Act on what you find
Champions and Loyal together are under 15% of your base
Champions and Loyal together are under 15% of your base
Your VIP segment is thin. Before investing in acquisition, focus on converting the Promising and Potential segments into repeat buyers. The most direct lever available in WISEPIM is product content: customers who had a good product experience are far more likely to return. Run AI enrichment on the products your top customers bought most. If you see the VIP count grow in subsequent periods, the enrichment is closing the trust gap. Outcome: a bigger, self-reinforcing VIP base without additional marketing spend.
Your At Risk segment is growing
Your At Risk segment is growing
At Risk customers bought before but are showing signs of lapsing, act before they cross into churned. Check the Top customers table to identify the highest-value at-risk accounts. Then look at the products they purchased in the Product Performance report. If those products have declining quality scores or falling revenue trends, enrich them with AI enrichment to ensure they still convert well on return visits. Set up a re-engagement campaign timed around the Time Patterns peaks for this customer group. Outcome: preventing LTV from being cut short on customers you already paid to acquire.
Acquisition is strong but retention rate is under 30%
Acquisition is strong but retention rate is under 30%
You are filling a leaky bucket. The unit economics only work if each customer buys more than once. Check Data Quality to see whether the products that most new customers first purchase have quality scores above 80, a poor first product experience is a major churn driver. Use AI enrichment to improve those entry-point products before spending more on acquisition. Outcome: a higher LTV per acquired customer, which makes the same acquisition budget generate more long-term revenue.
Churn rate is rising month over month
Churn rate is rising month over month
Rising churn is a compounding problem: the customers you lose now cannot contribute to LTV. Check whether the churn accelerated after a specific date, if so, cross-reference with Time Patterns to see if there was a drop in repeat visit frequency around the same time. Look at Product Performance for the products churned customers purchased: a quality or availability issue on a popular product can trigger a wave of churn. Fix the root product issues via AI enrichment or pricing adjustments. Outcome: stopping the churn bleeding at its source rather than trying to re-acquire customers you already lost.
Recent cohorts plateau earlier than older ones
Recent cohorts plateau earlier than older ones
When a recent cohort’s LTV line on the cohort chart flattens sooner than older vintages, acquisition quality is declining. Check Marketing Attribution to see which channels are driving the newer cohorts, if a new channel is producing lower-LTV customers, it should be deprioritised or the entry experience improved. Cross-check the products those cohorts first bought in Product Performance to see if a weaker product category is now attracting new customers. Outcome: spending acquisition budget on channels and products that produce customers who actually stick.
Related
Conversions
Optimize the path from visitor to first-time customer.
Marketing Attribution
See which marketing channels bring your most valuable customers.
Time Patterns
Find when your customers are most active and time your outreach.