This report needs order history plus a record of which products were enriched and when. It becomes meaningful once you have enriched products and collected sales data from the period after enrichment. The comparison window is 30 days before versus 30 days after each enrichment event.
Key metrics
Because net lift removes the market baseline, a product can show a negative gross change but still be a winner: if the whole category dipped and your enriched SKU dipped less, the report flags it as “likely seasonal, not the enrichment” rather than a regression. Separately, each SKU’s drawer tells you whether the enrichment has earned back the credits it cost, that payback check is about cost, not the lift calculation.
What good looks like
There is no single benchmark for enrichment lift, because it depends on how incomplete the content was before enrichment. That said:- A net lift of +10 % or more on a batch of products is a strong signal that content was the bottleneck for those SKUs.
- Even a +5 % net lift on high-revenue products represents meaningful incremental income.
- Products with low confidence need more sales data, check back after another 2–4 weeks.
- Regressions in high-confidence products are worth investigating: they may reflect seasonal effects, a price change, or content that set expectations the product could not meet.
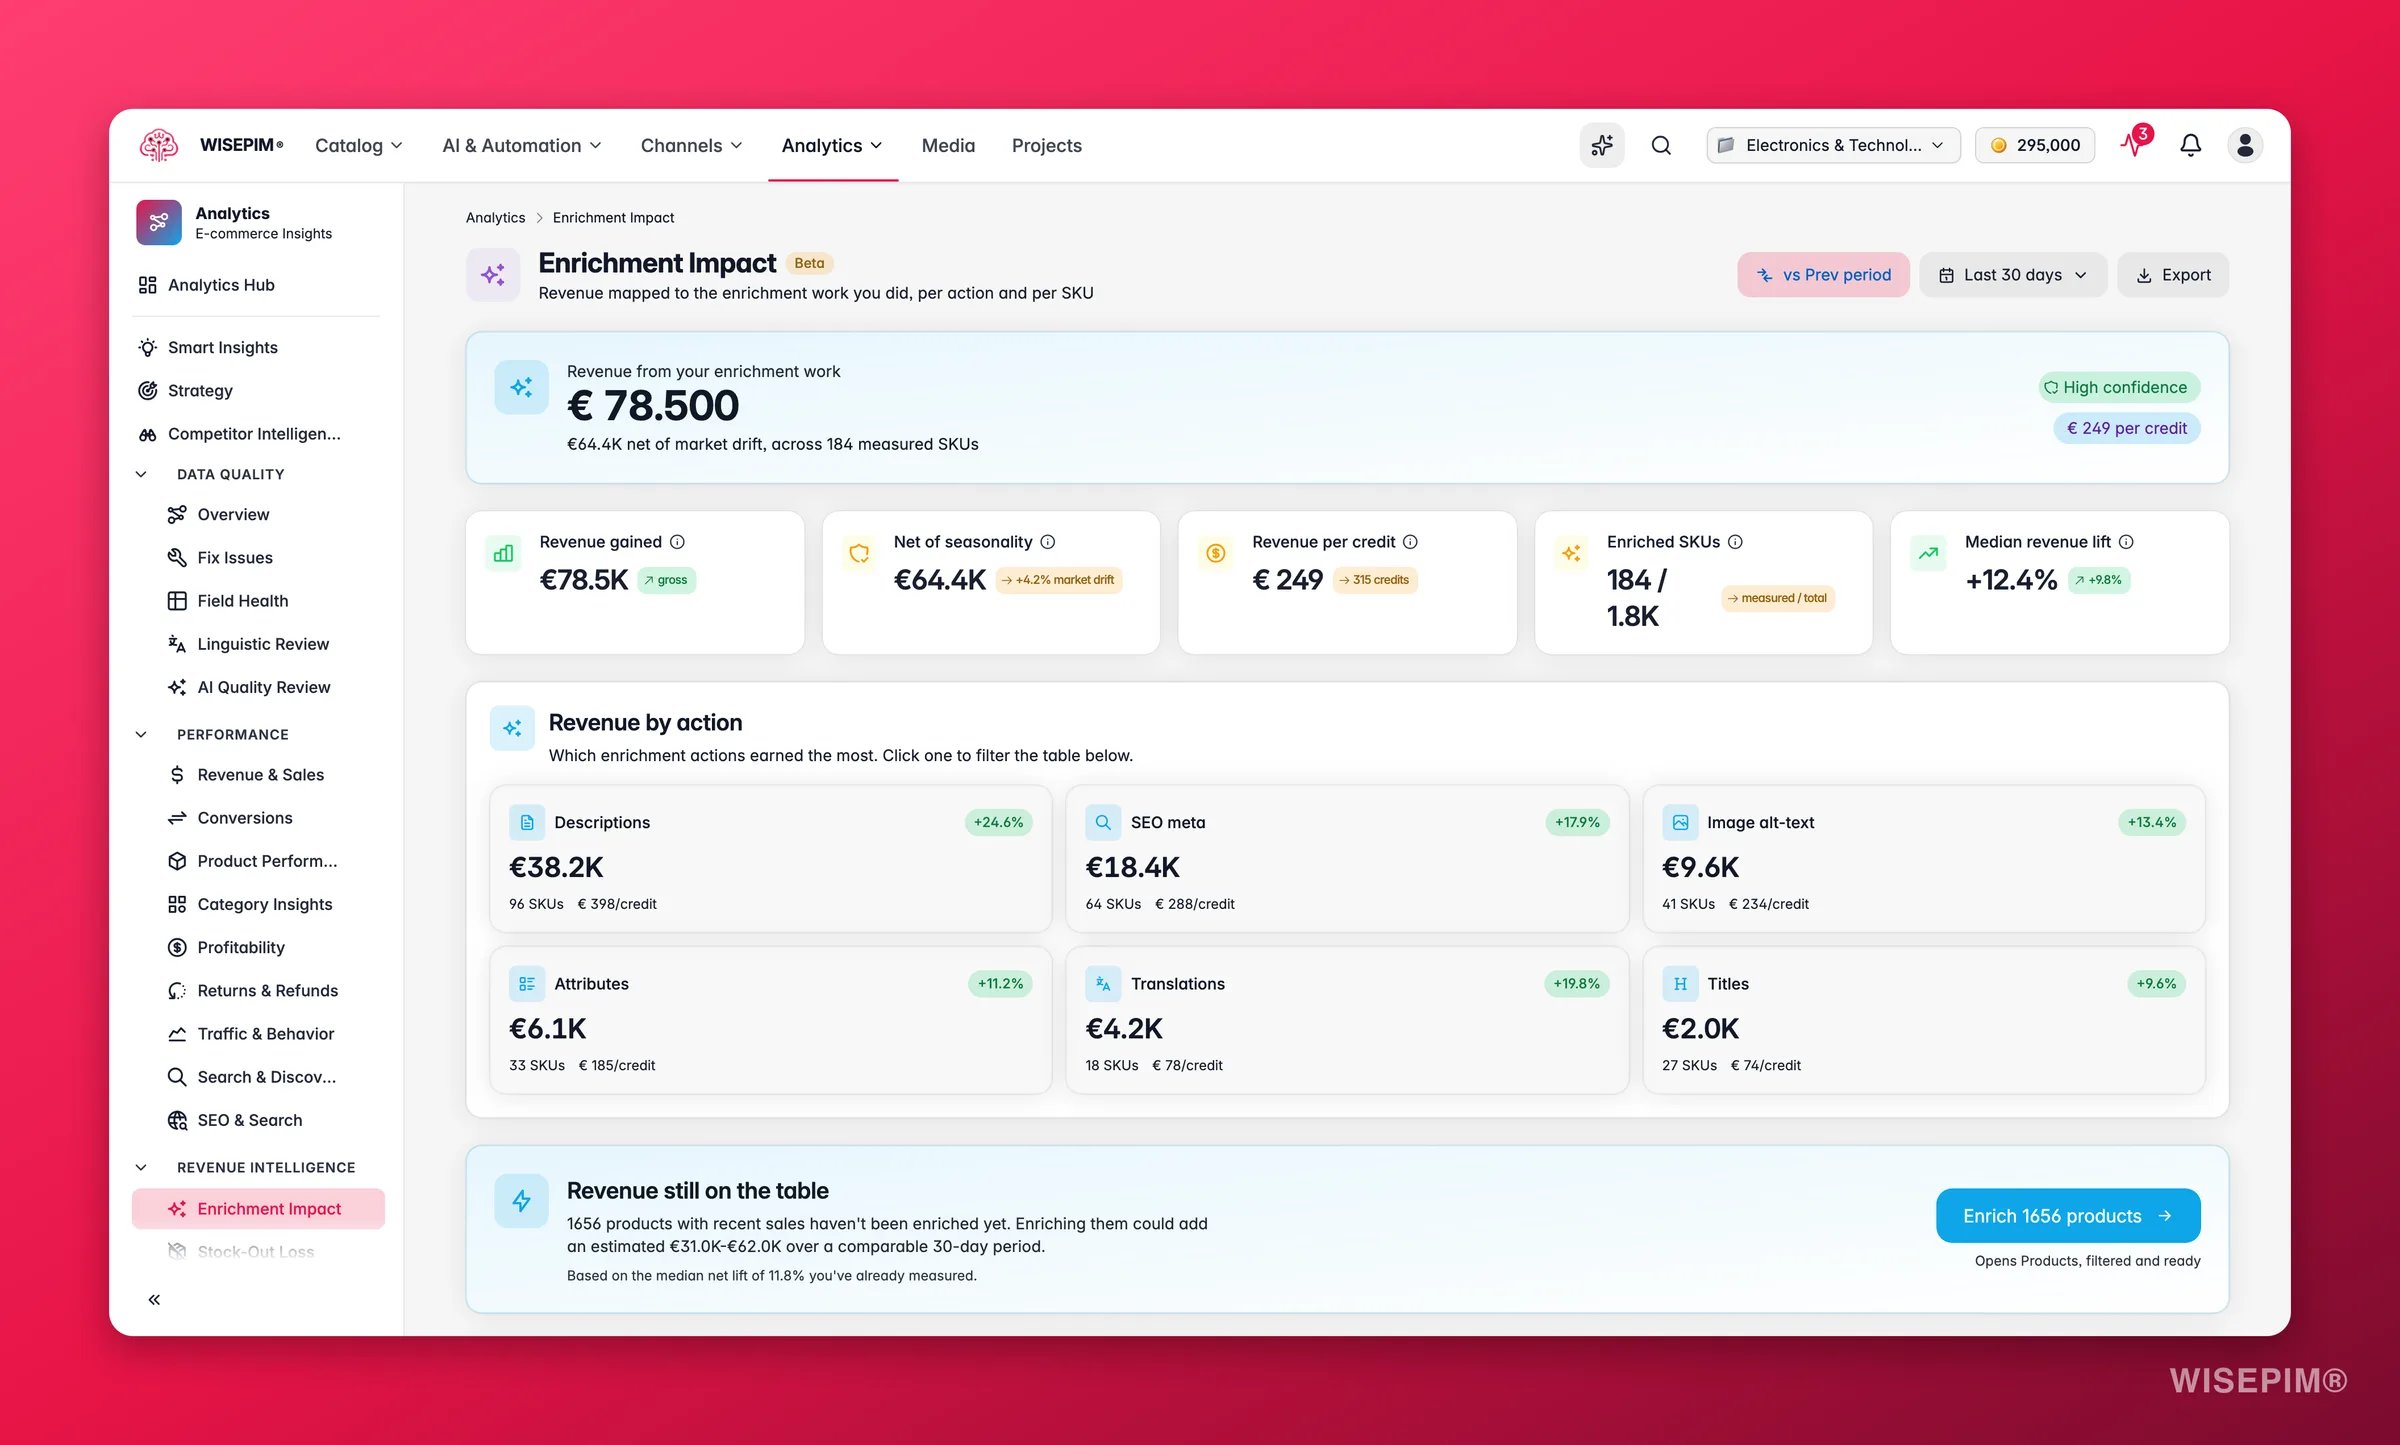
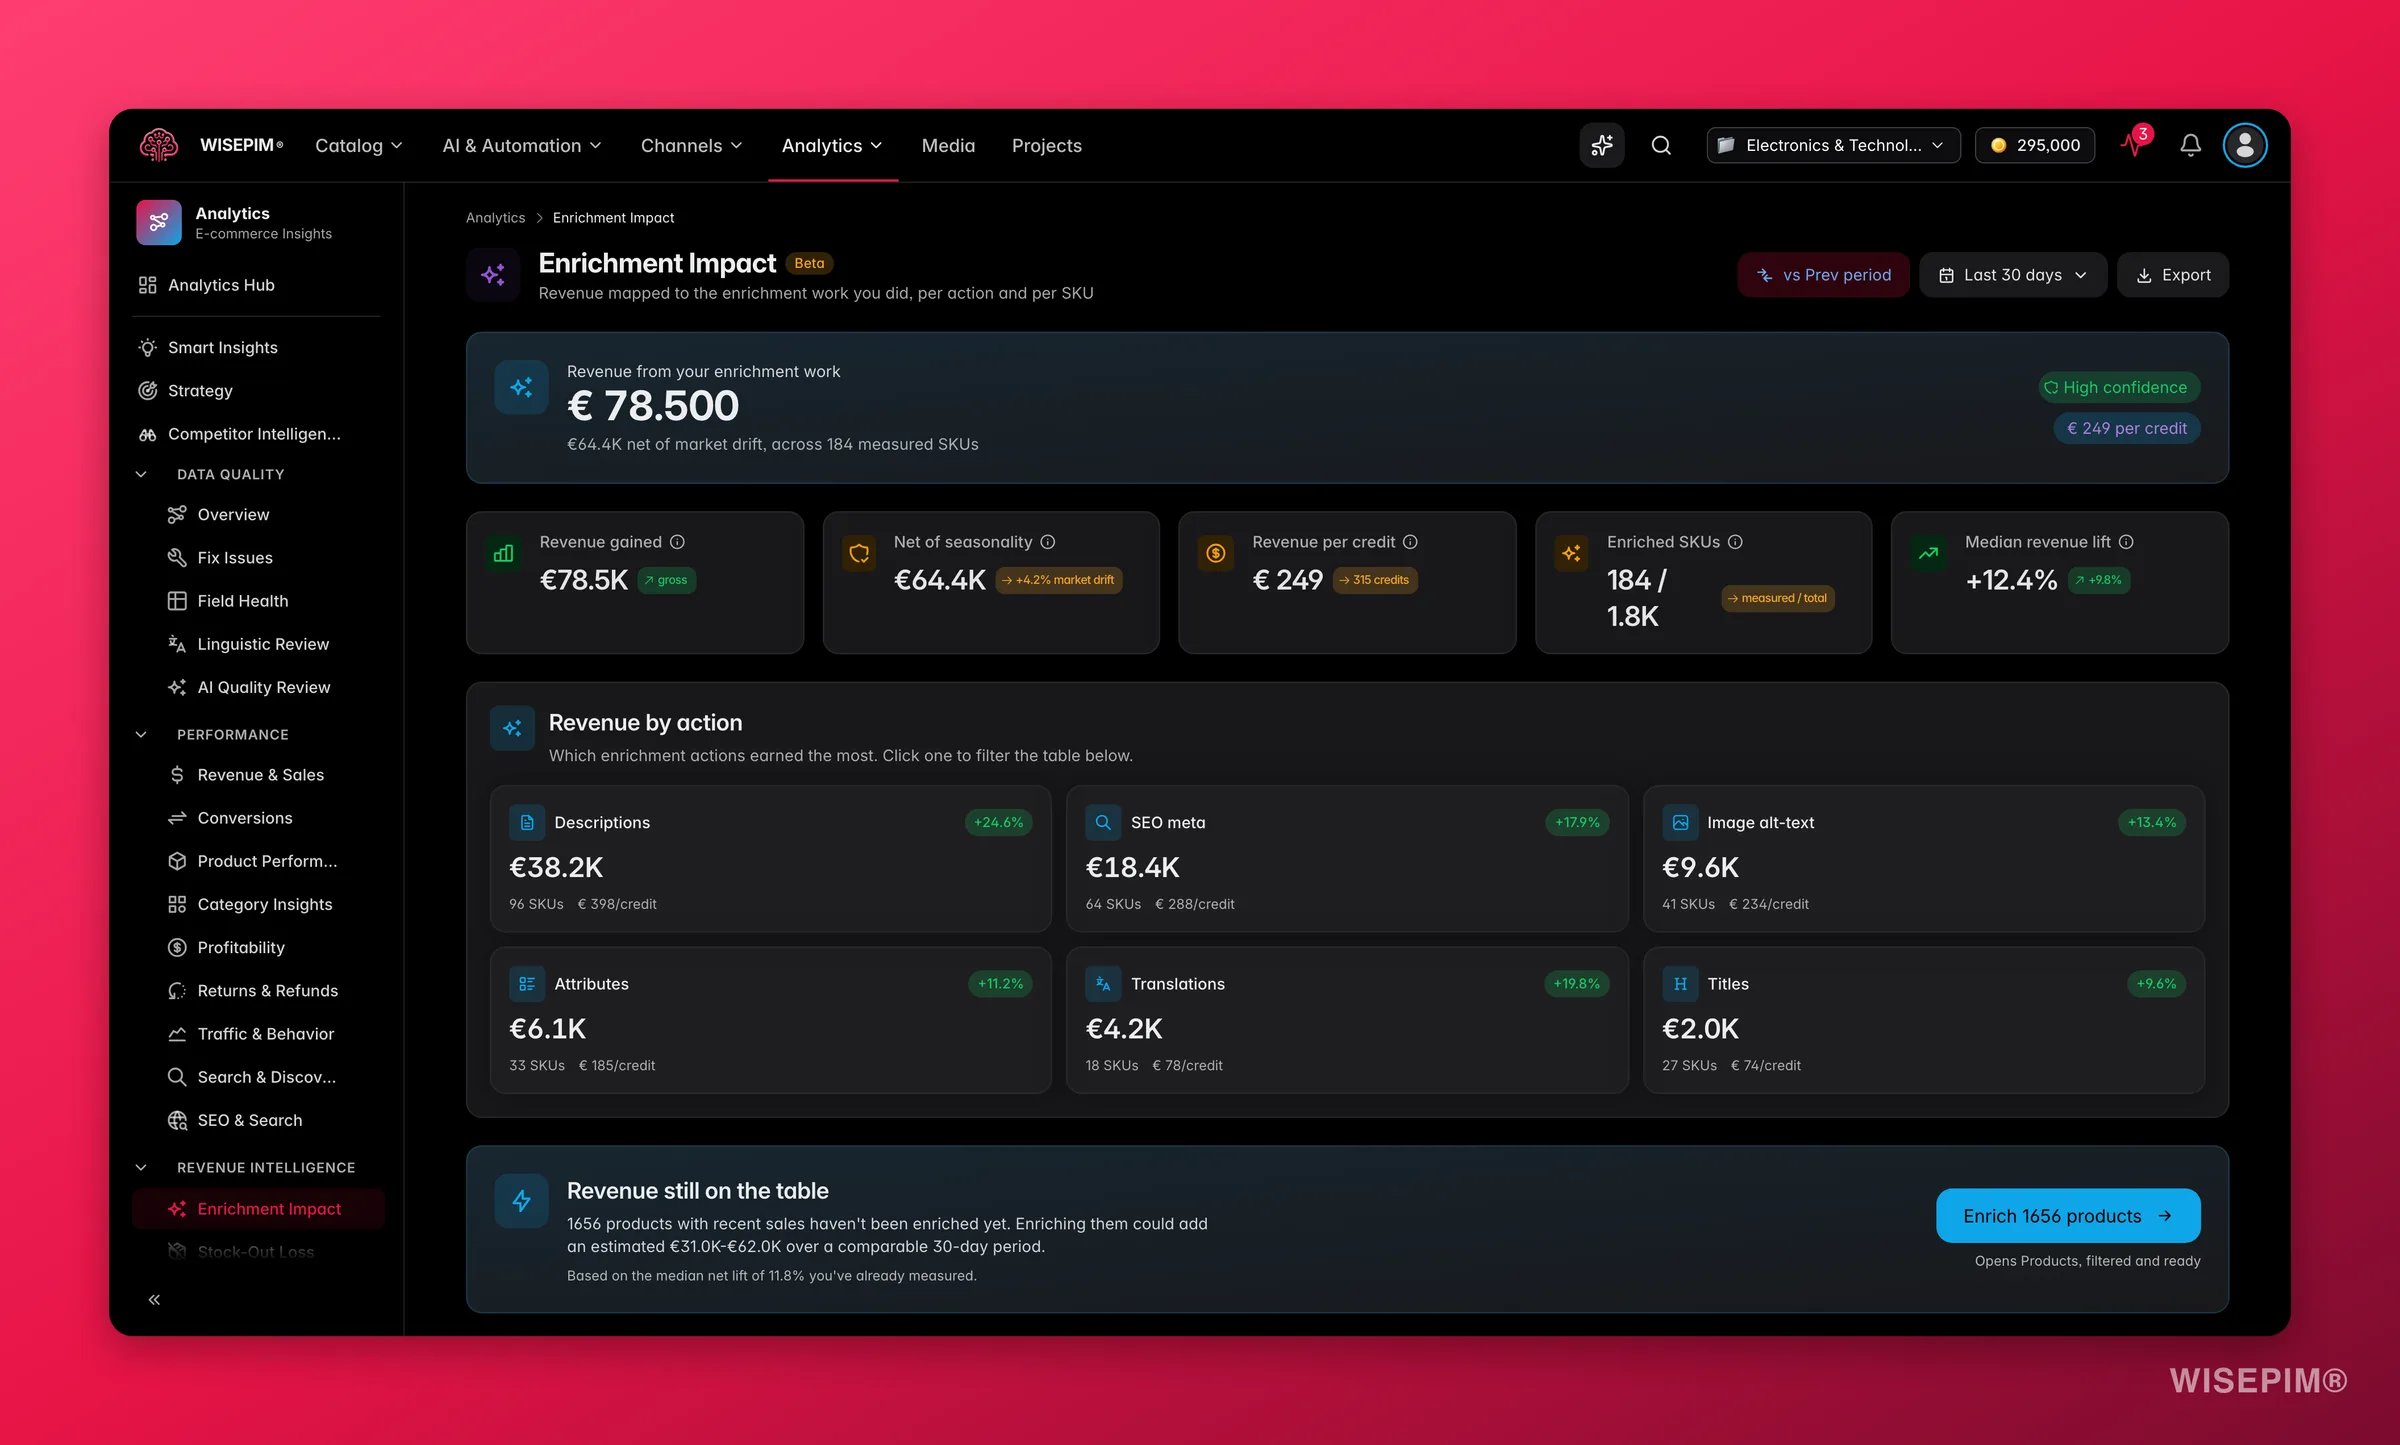
Revenue lift per product
The report shows the revenue change for products after they were enriched, and breaks the lift down by what you improved, titles, descriptions, images, specs, or SEO content, so you can see which kind of enrichment moves the needle most. The Revenue by enrichment action bar chart shows cumulative incremental revenue per action type. If “description” consistently produces the biggest bars, that is where to focus your next enrichment run.Before and after, per SKU
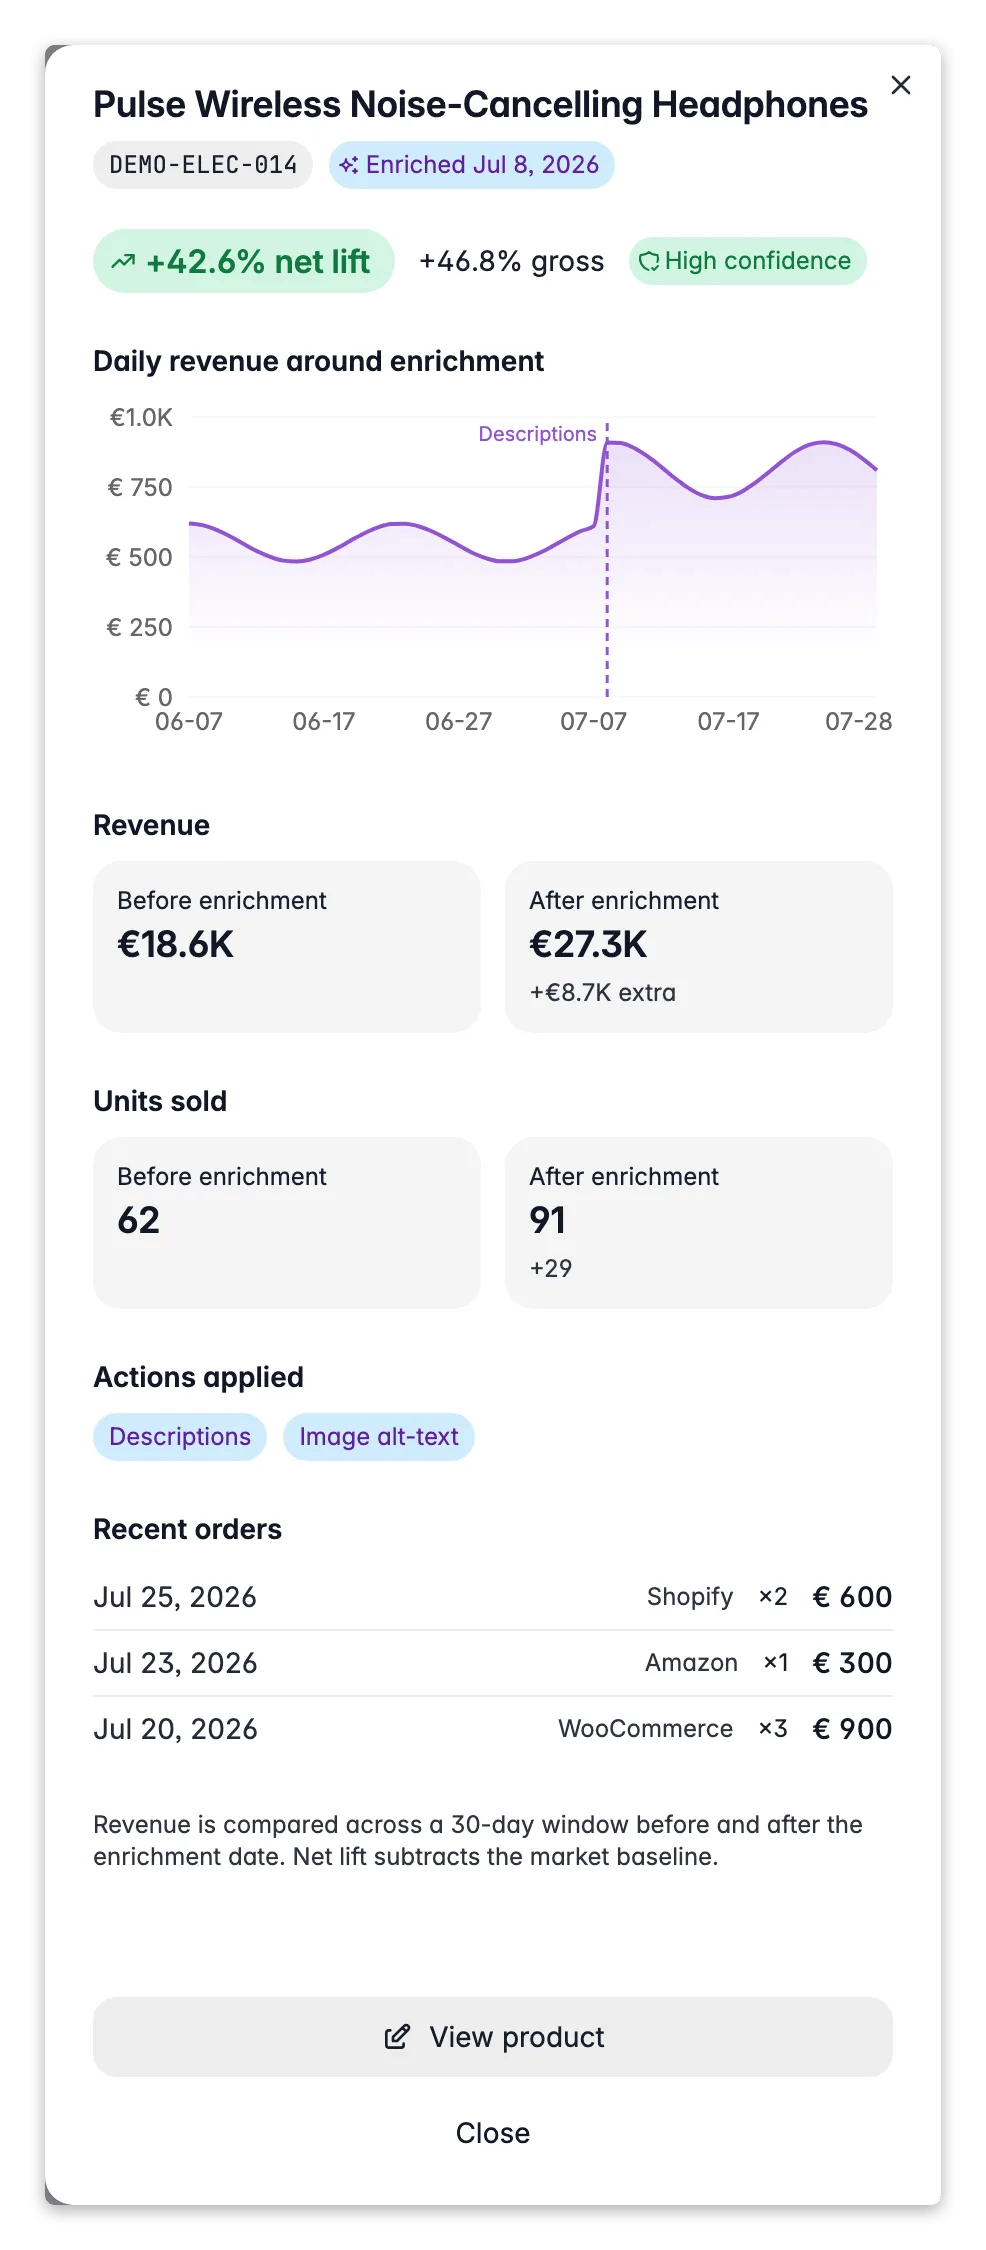
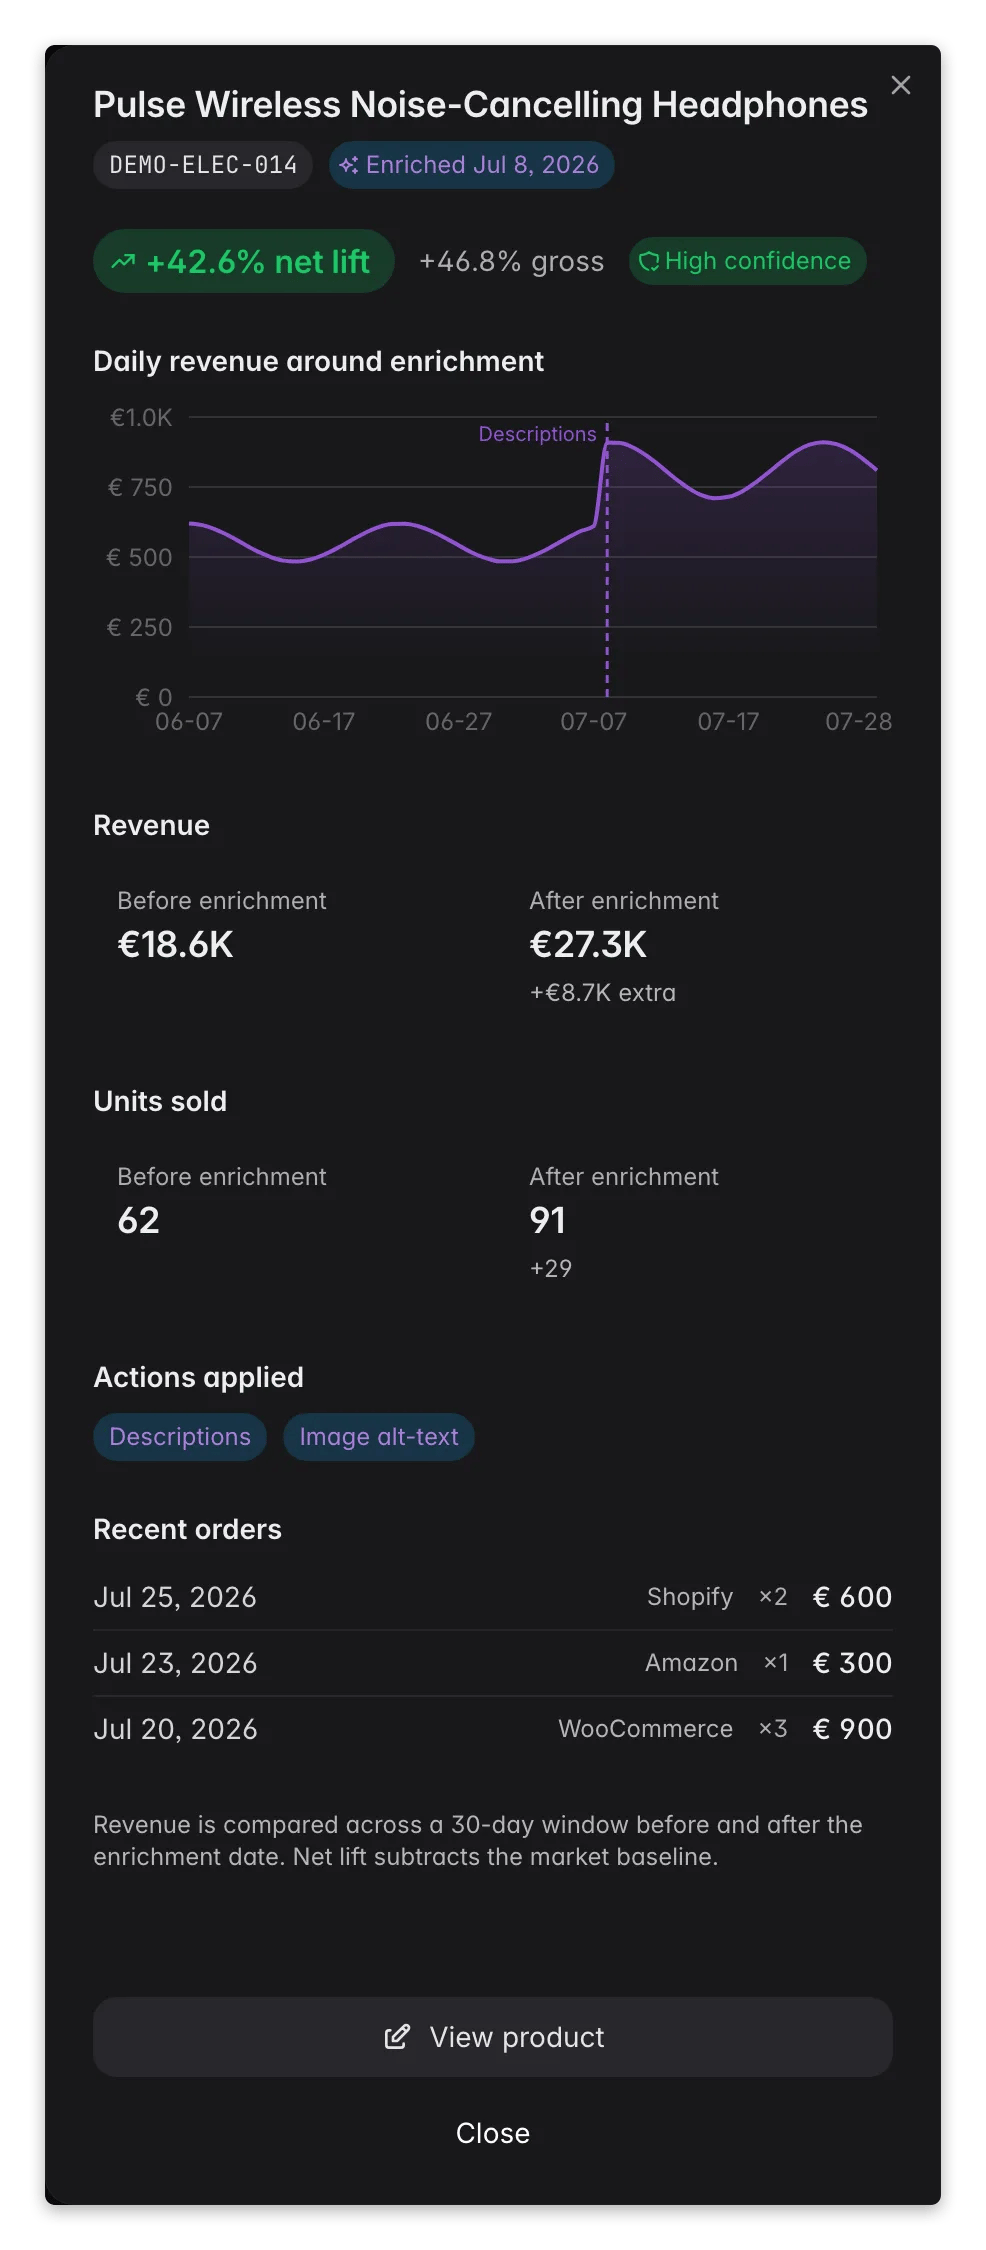
Reading the results
- Cumulative trend rising steadily: enrichment is generating a compounding return as more SKUs are improved and accumulate post-enrichment sales history.
- Winners clustered in one action type: the catalog had a specific weakness (e.g., all products lacked descriptions). Focus bulk enrichment runs on that action type across unenriched SKUs.
- High-confidence regressions: worth opening the drawer to check: did the product change price, category, or competitive context at the same time? A true regression on clean data may mean the new content set expectations the product could not meet.
- No data yet / “No measurable enrichment impact”: either no products have been enriched yet, or enrichment happened too recently to collect post-enrichment sales. Enrich a batch of products that are already selling, wait 3–4 weeks, then check back.
Act on what you find
Winners with high confidence, scale up
Winners with high confidence, scale up
These SKUs prove the ROI. Use their action types (title, description, specs, images) as a template and run the same enrichment on unenriched products in the same category or price band. Go to Enriching Products to run a bulk enrichment pass. Outcome: replicate proven revenue lift across more of the catalog.
One enrichment action type outperforms others
One enrichment action type outperforms others
If the “Revenue by enrichment action” chart shows descriptions or specs generating far more lift than other actions, prioritize that action in your next enrichment campaign. The report tells you which type of content work has the highest return. Outcome: better ROI per credit spent on enrichment.
Large catalog still unenriched
Large catalog still unenriched
Use this report’s Enrich products shortcut (shown when there’s no data yet), or go to the Products page and click Enrich with AI - see Enriching Products - to filter products with missing descriptions, then enrich in batches. Focus on products that already have sales velocity, enriching slow movers is harder to measure and lower priority. Outcome: grow the set of SKUs contributing to the incremental revenue total.
High-confidence regressions appear
High-confidence regressions appear
Open each regressing SKU’s drawer and review: did a price change, category move, or competitive shift coincide with enrichment? If the content itself set expectations the product could not meet, revise the copy or images. Consider re-enriching with different guidance via Enriching Products. Outcome: turn regressions into neutral or positive performers by refining the enrichment approach.
Related
Enriching Products
Run the AI enrichment that this report measures.
Product Performance
See sales and quality together, per product.
Data Quality
Track the content score that enrichment improves.
Smart Insights
Find the next products worth enriching.