> ## Documentation Index
> Fetch the complete documentation index at: https://docs.wisepim.com/llms.txt
> Use this file to discover all available pages before exploring further.
# Run a weekly catalog health routine
> Nine screens tell you to check them regularly and none says when. This is the Monday round that keeps quality, feeds, and syncs healthy in under an hour.
Nine screens in WISEPIM tell you to "check this regularly". None of them tells you when, in what order, or how they relate to each other. So you check whatever you happen to open, miss the thing that actually broke, and find out three weeks later that a sync has been failing quietly since the start of the month.
This guide is the missing cadence: one round of nine stops, always in the same order. Read the signals, clear the queues, then spend what's left building one thing. The order is the point - the reading stops are what tell you where the fixing time should go, and doing it the other way round means you fix whatever you happened to open first.
Monday specifically, because [Competitor Intelligence](/en/analytics/competitors) re-analyzes your rivals every Monday and stop 3 is only fresh on that day. Budget 45 to 60 minutes: roughly 15 reading, 20 clearing, and the remainder building.
**Before you start:** you need a project with products and at least one connected channel under [Integrations](/en/integrations/supported-platforms). Reports that read sales data, like [Smart Insights](/en/analytics/smart-insights), also need order history to say anything useful.
**What you'll get:** a repeatable hour that ends with green syncs, an empty quarantine queue, and one improvement shipped, instead of a vague feeling that something needs attention.
## Read the signals - about 15 minutes
The first four stops are read-only, and they run broadest to narrowest: your whole catalog, then the money, then the market, then the plumbing. Write findings down instead of acting on them. The one exception is stop 4 - a red channel is costing you sales right now, so that one you fix on sight.
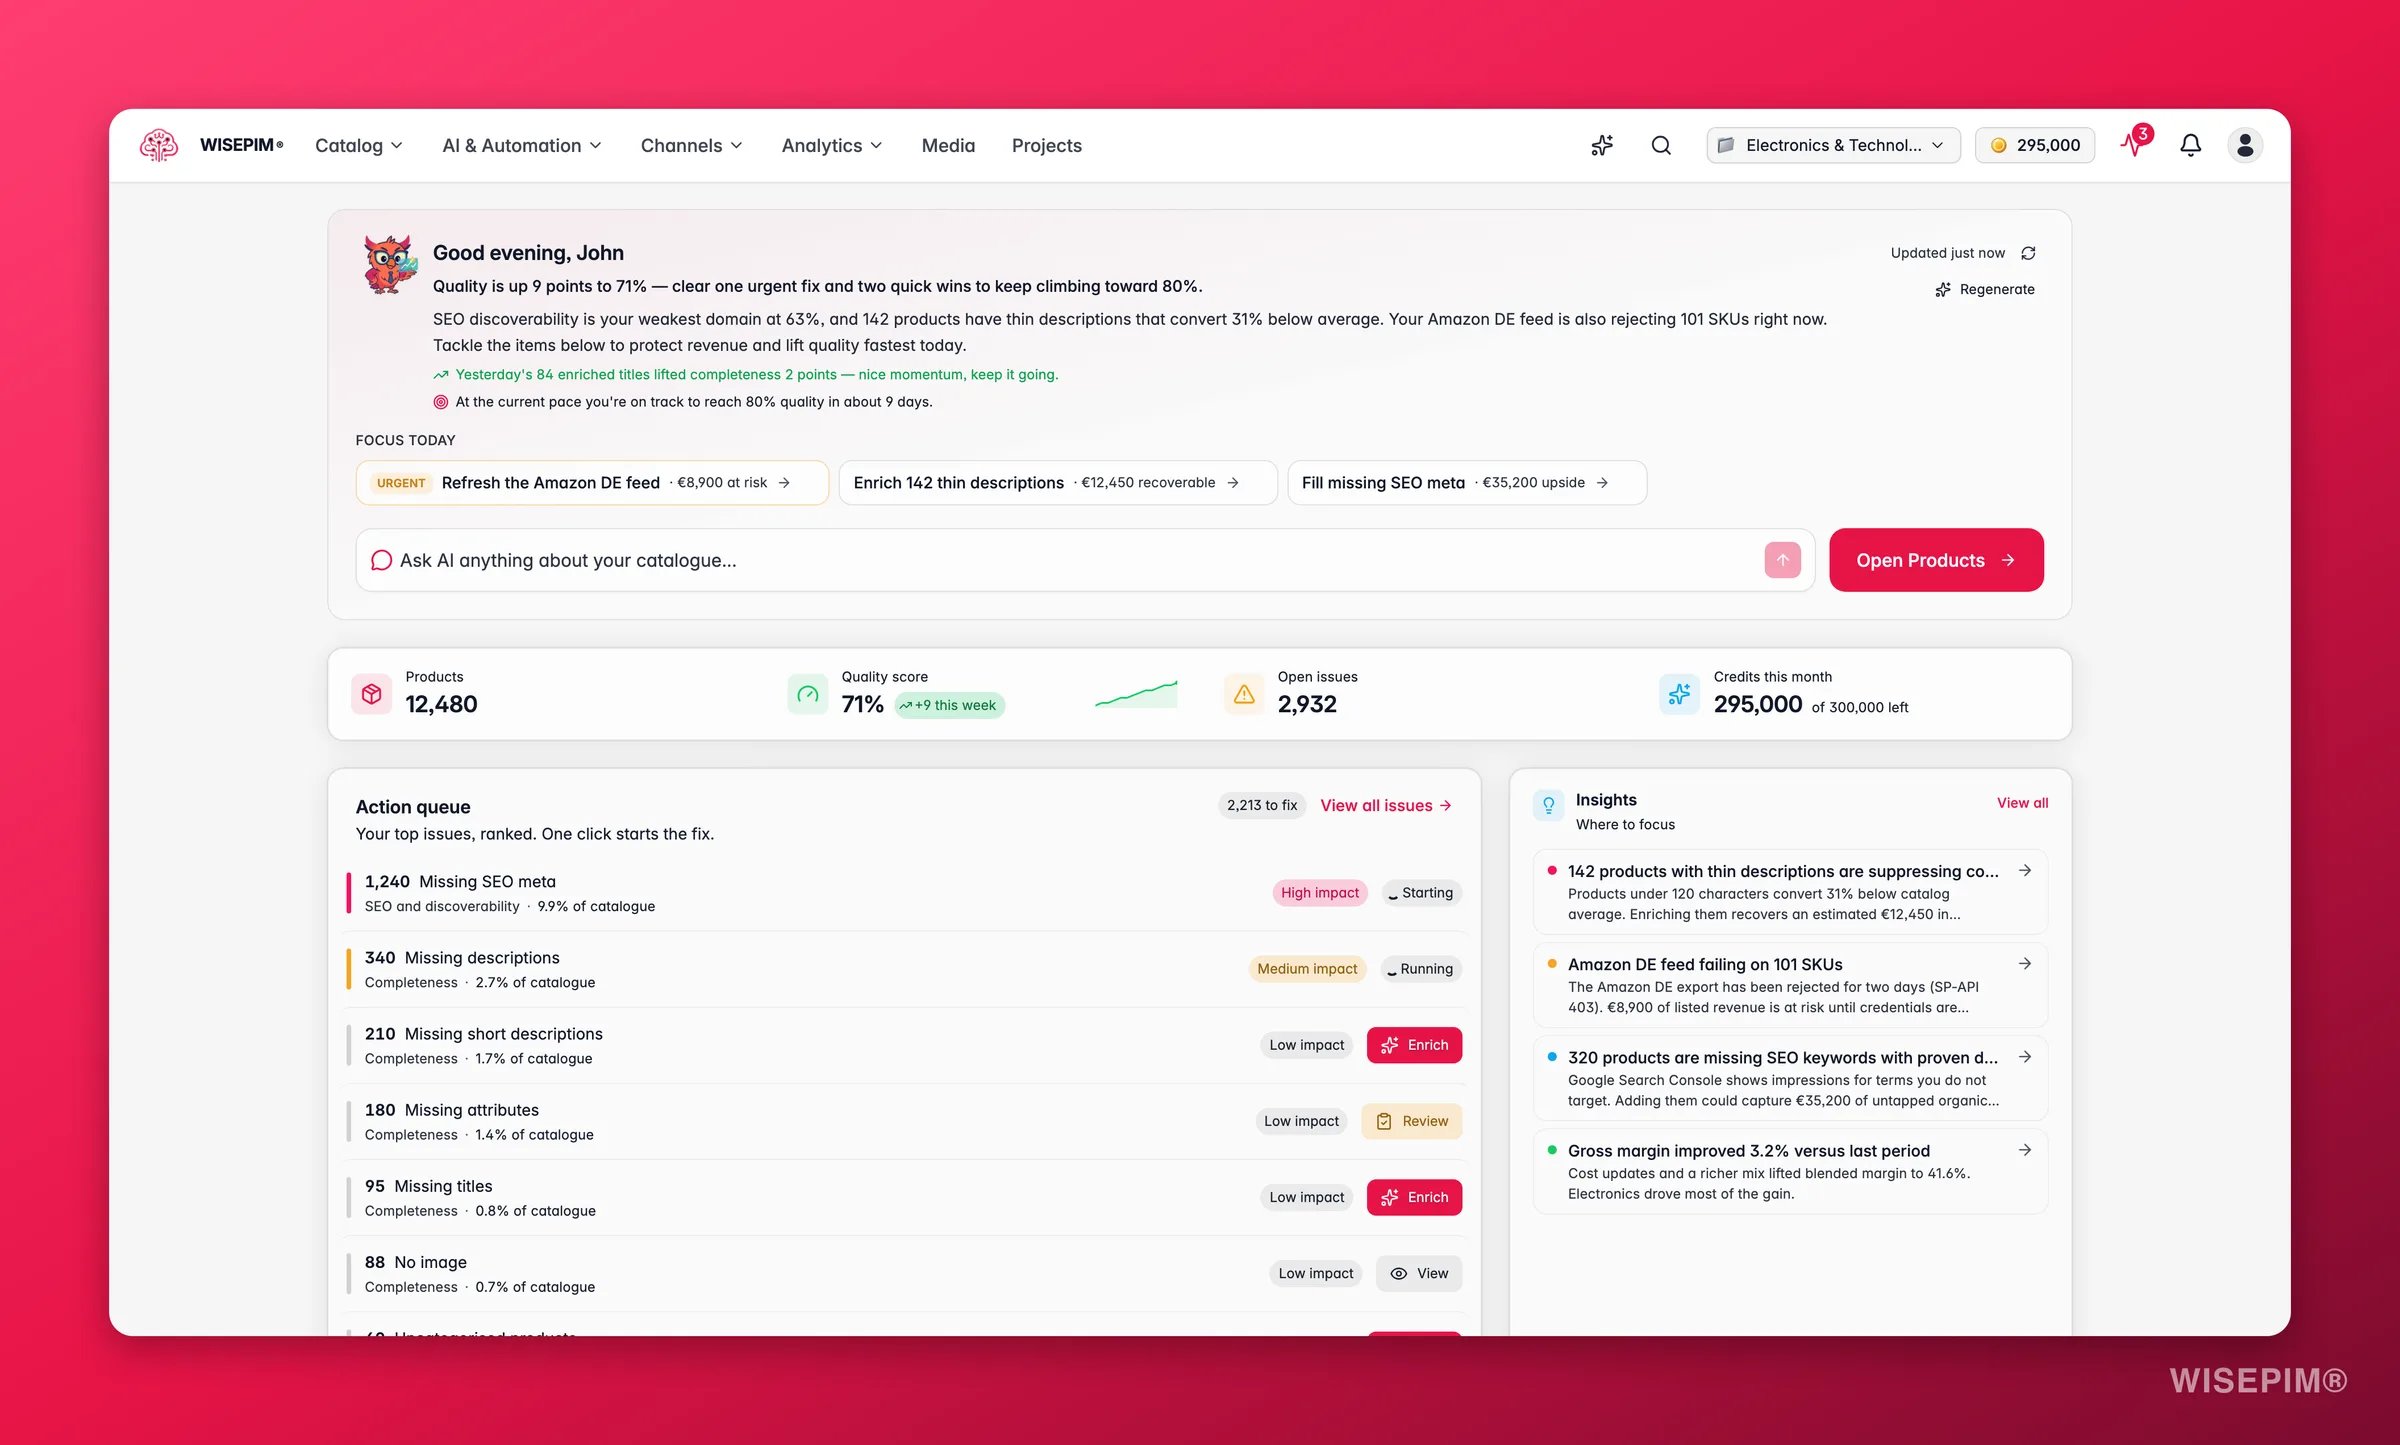
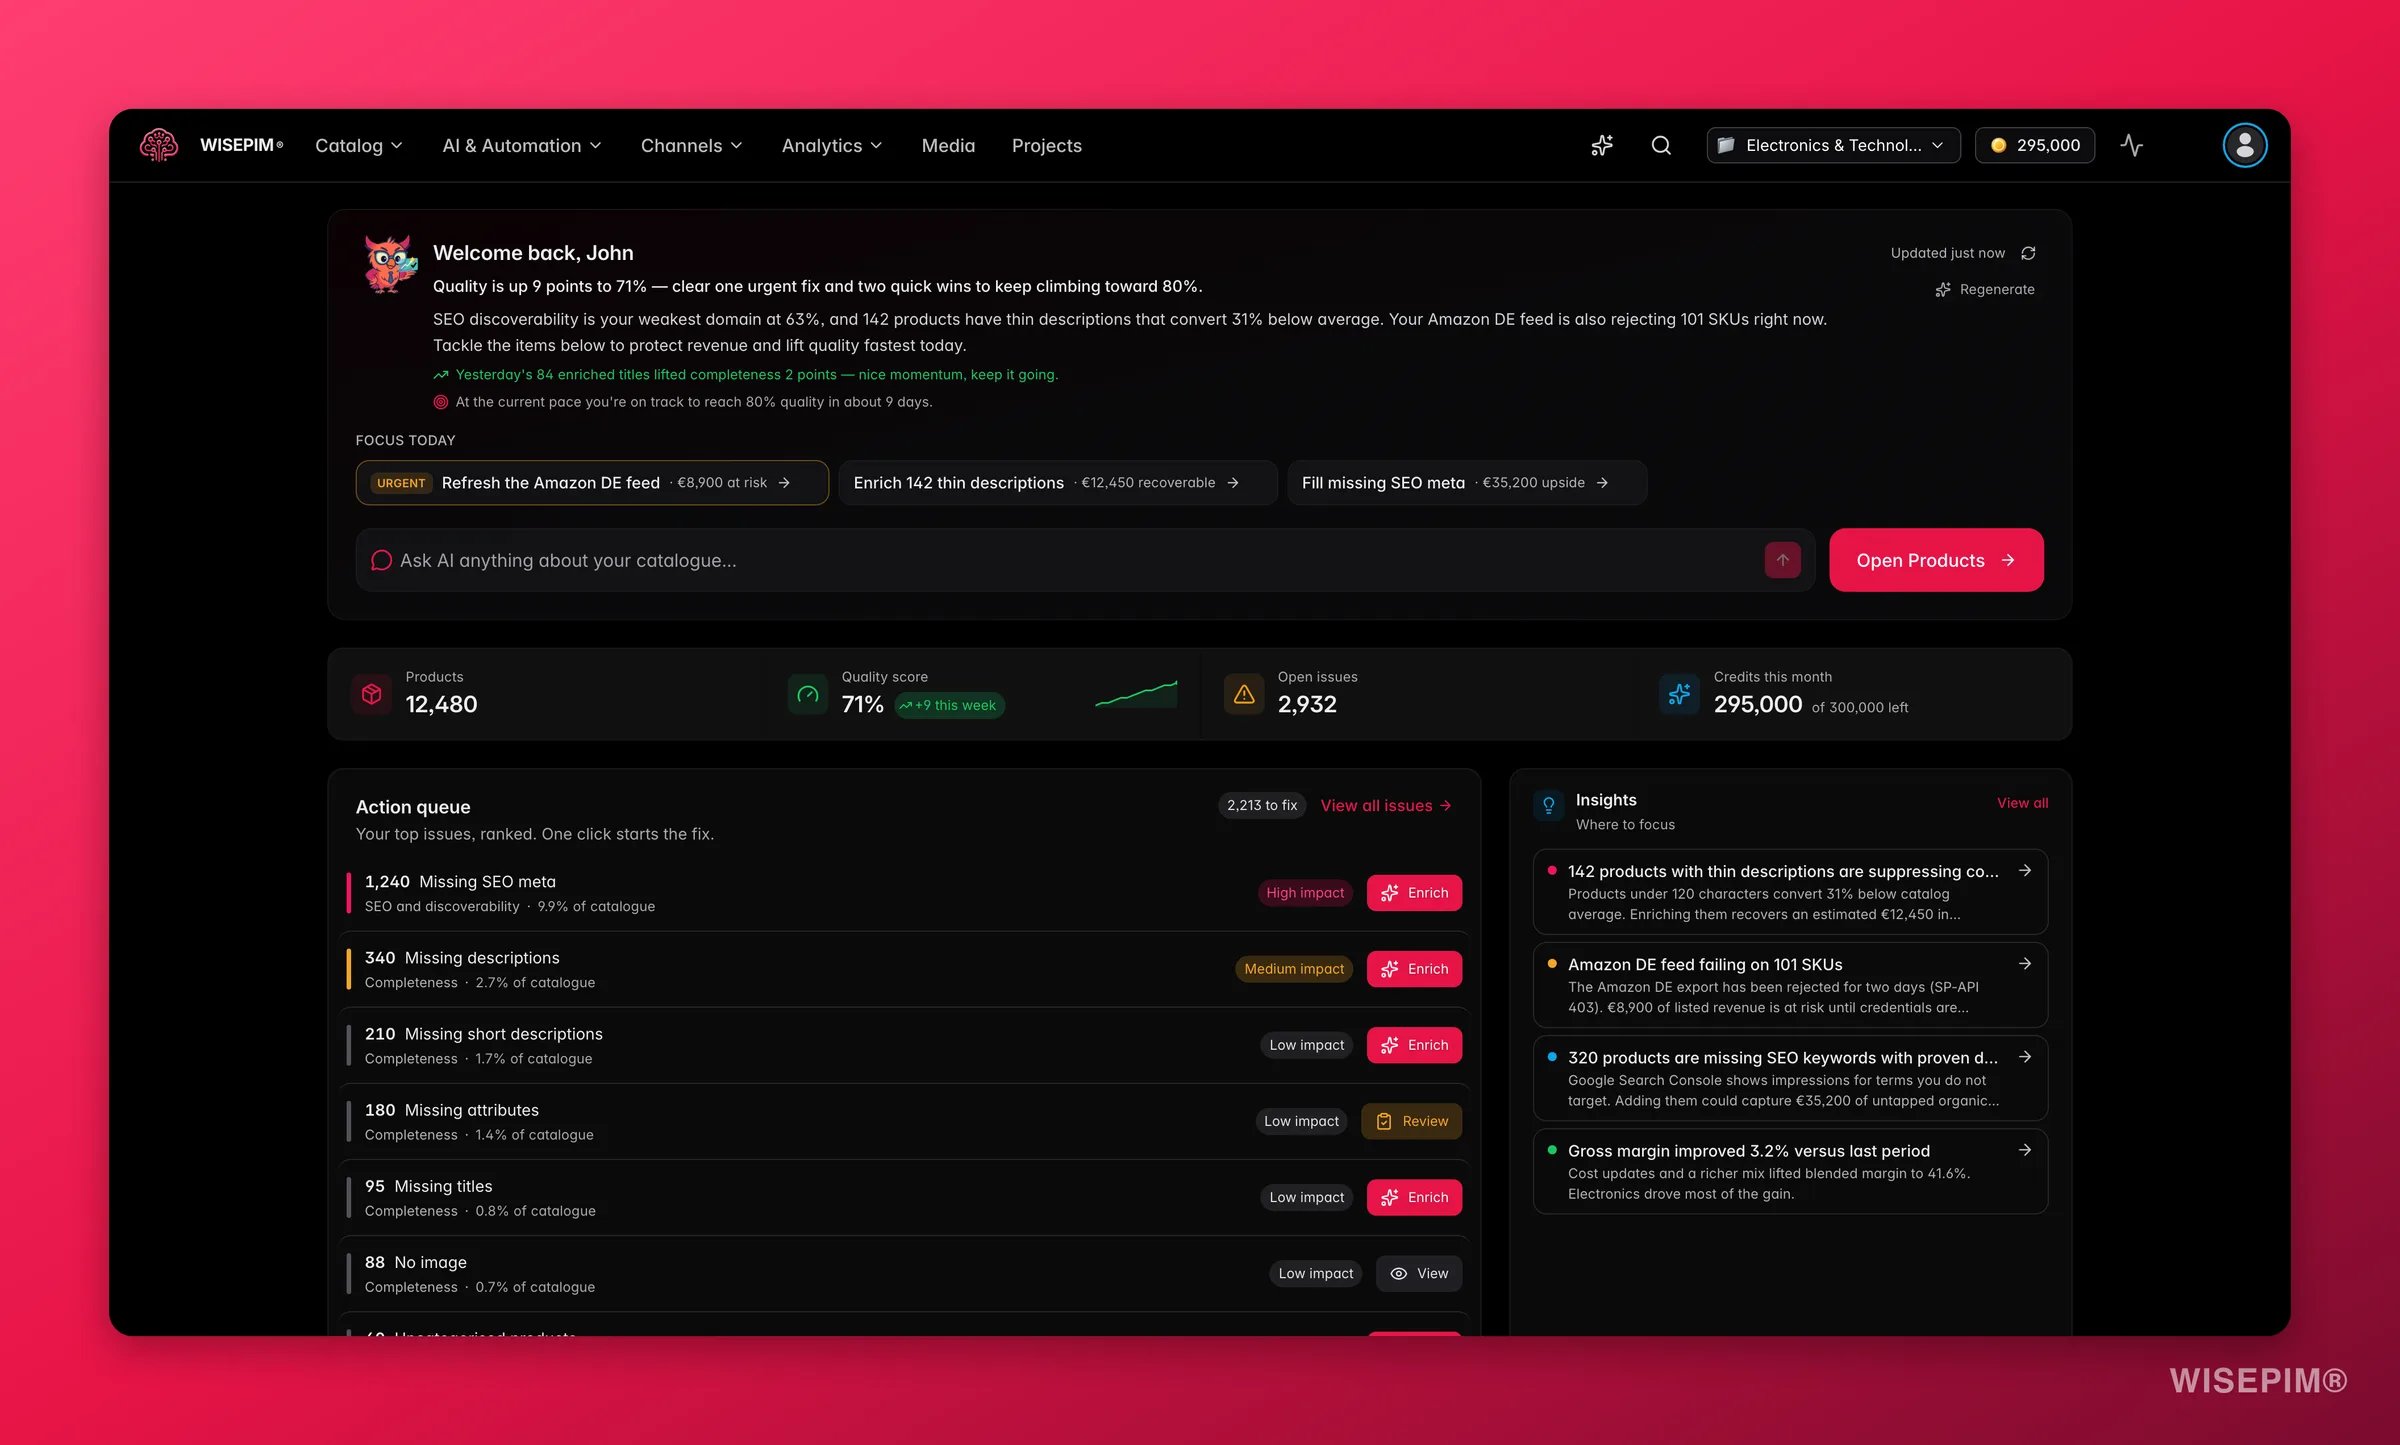 Start at the [Overview](/en/overview). Read the health score and its trend, then the daily briefing, then skim the action queue, which is already ranked by how much each gap moves your score. A drop since last week almost always traces back to an import or a sync that brought in incomplete data, and the recent-activity feed will name it.
Open [Smart Insights](/en/analytics/smart-insights). Its rollup splits everything into money you are losing to a fixable cause, metrics heading the wrong way, and upside worth chasing. A large recoverable total spread over only a handful of SKUs is the highest-value thing on your screen this morning; note it and move on.
Read **What changed since last analysis** on [Competitor Intelligence](/en/analytics/competitors), then the **Start here** card: it names your single highest-impact move with impact and effort chips, so you can judge it in seconds. Note it - it is a strong candidate for the build at the end of the round.
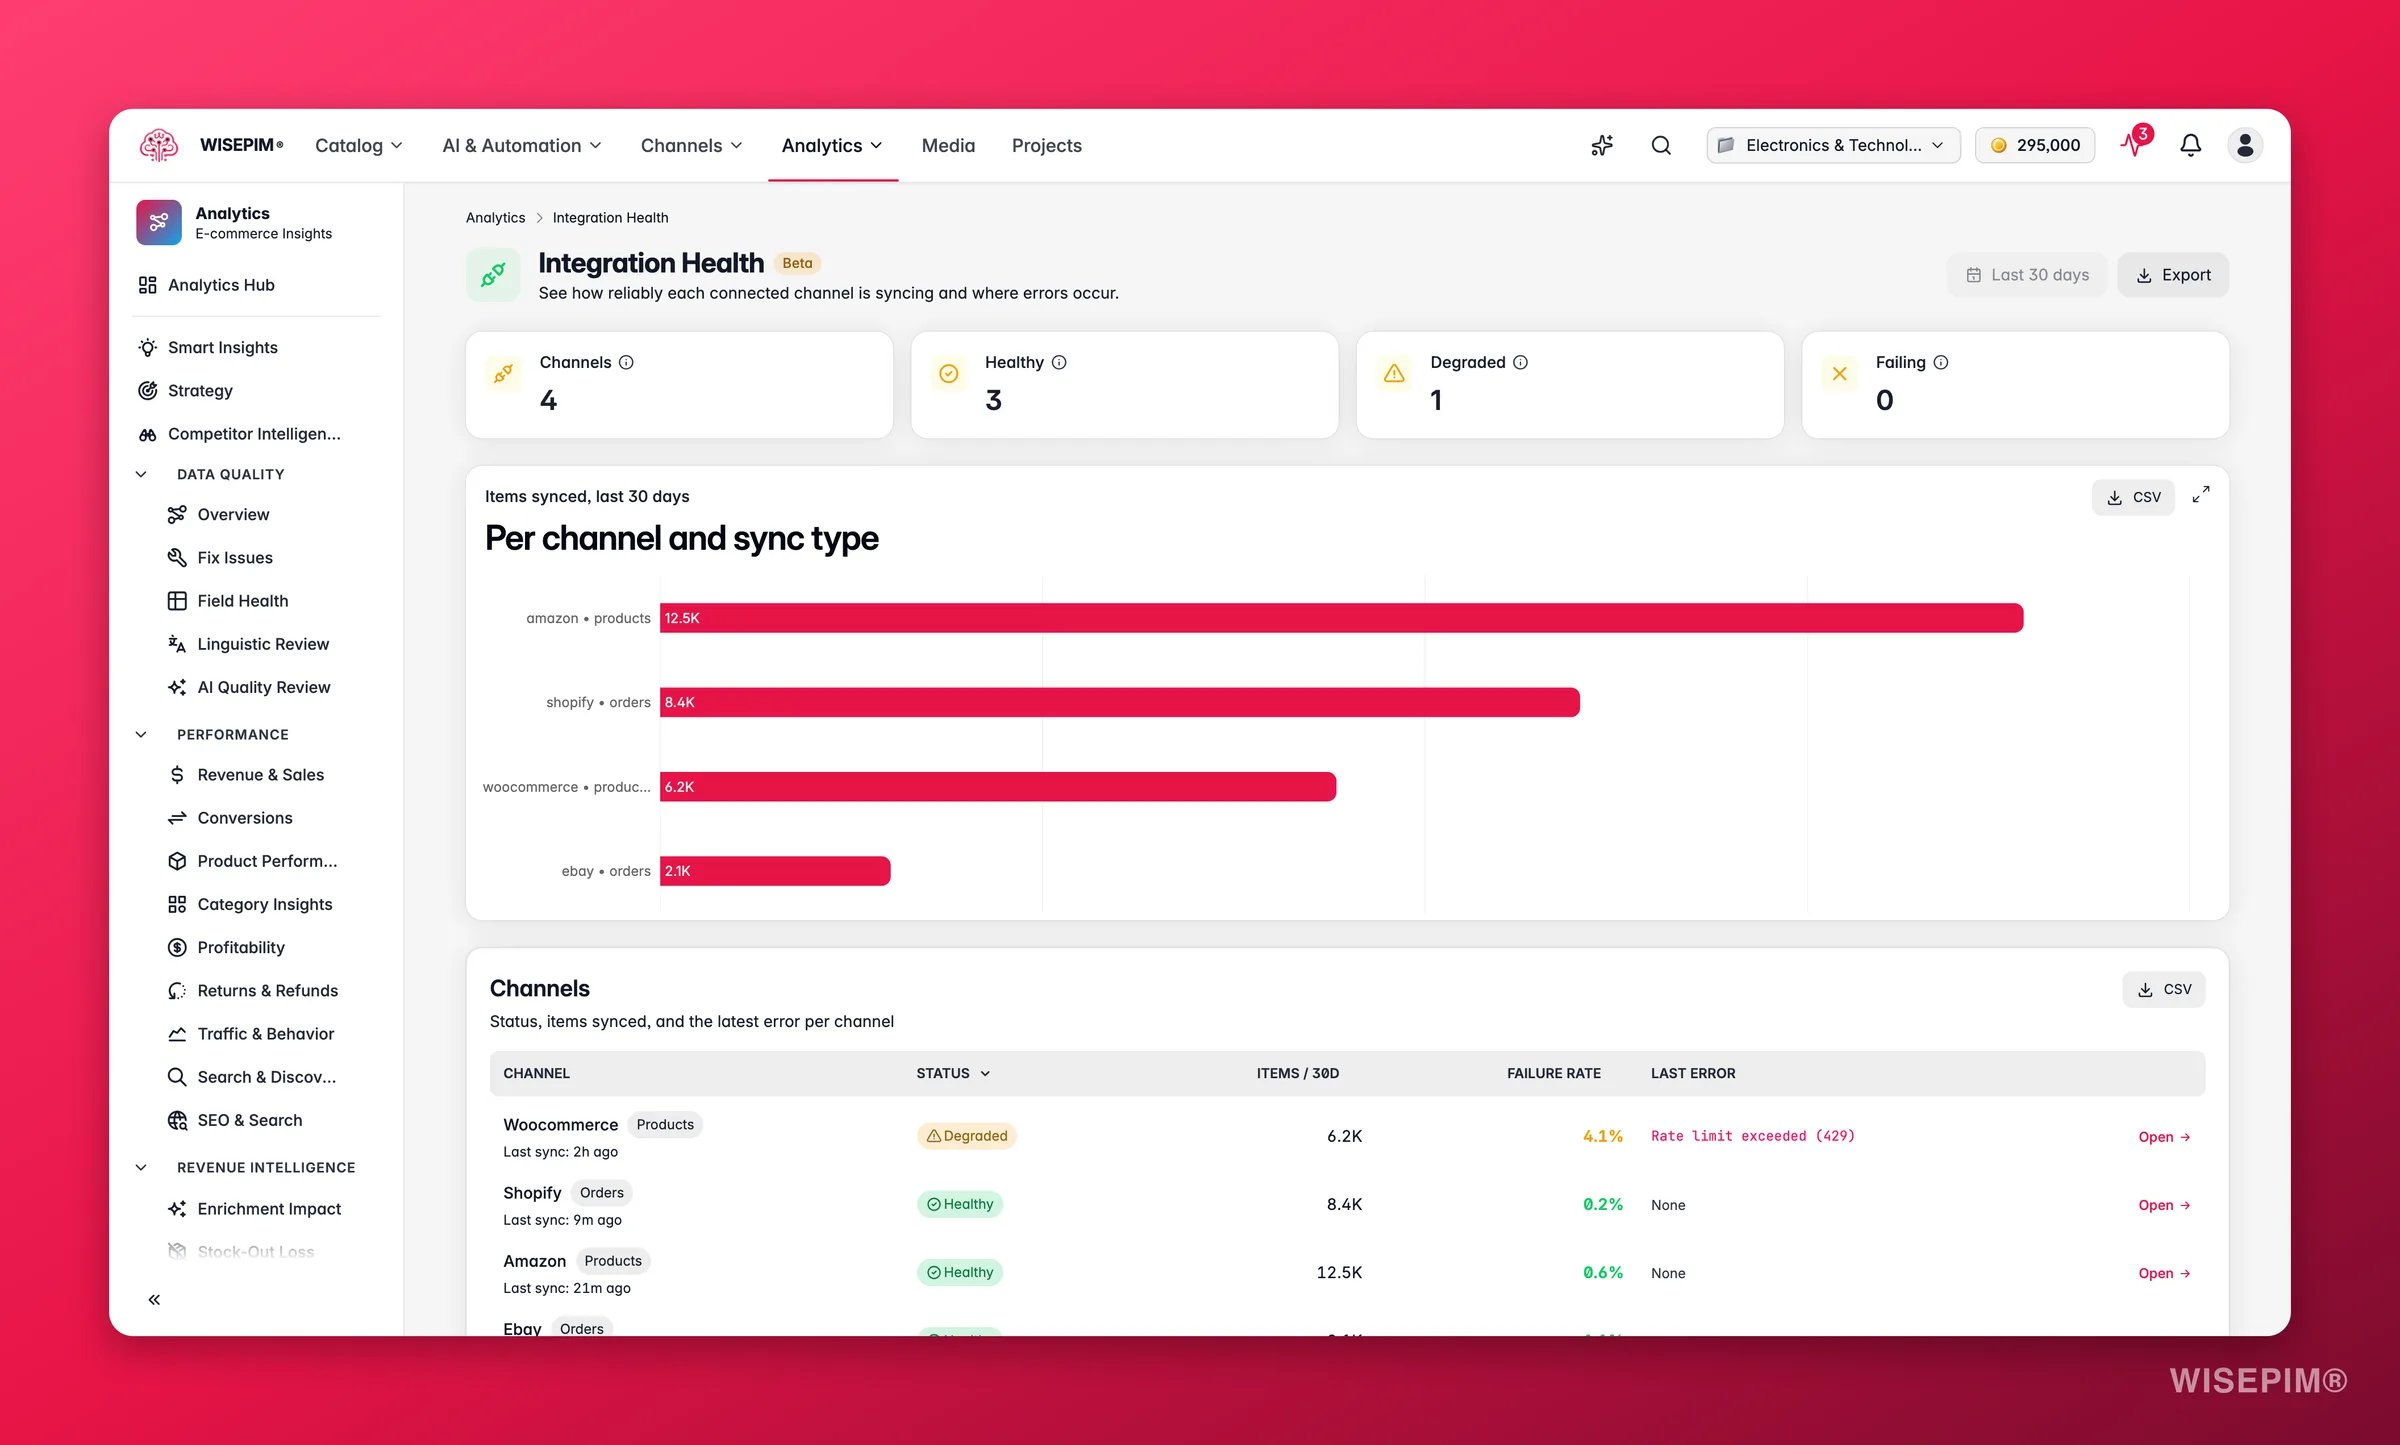
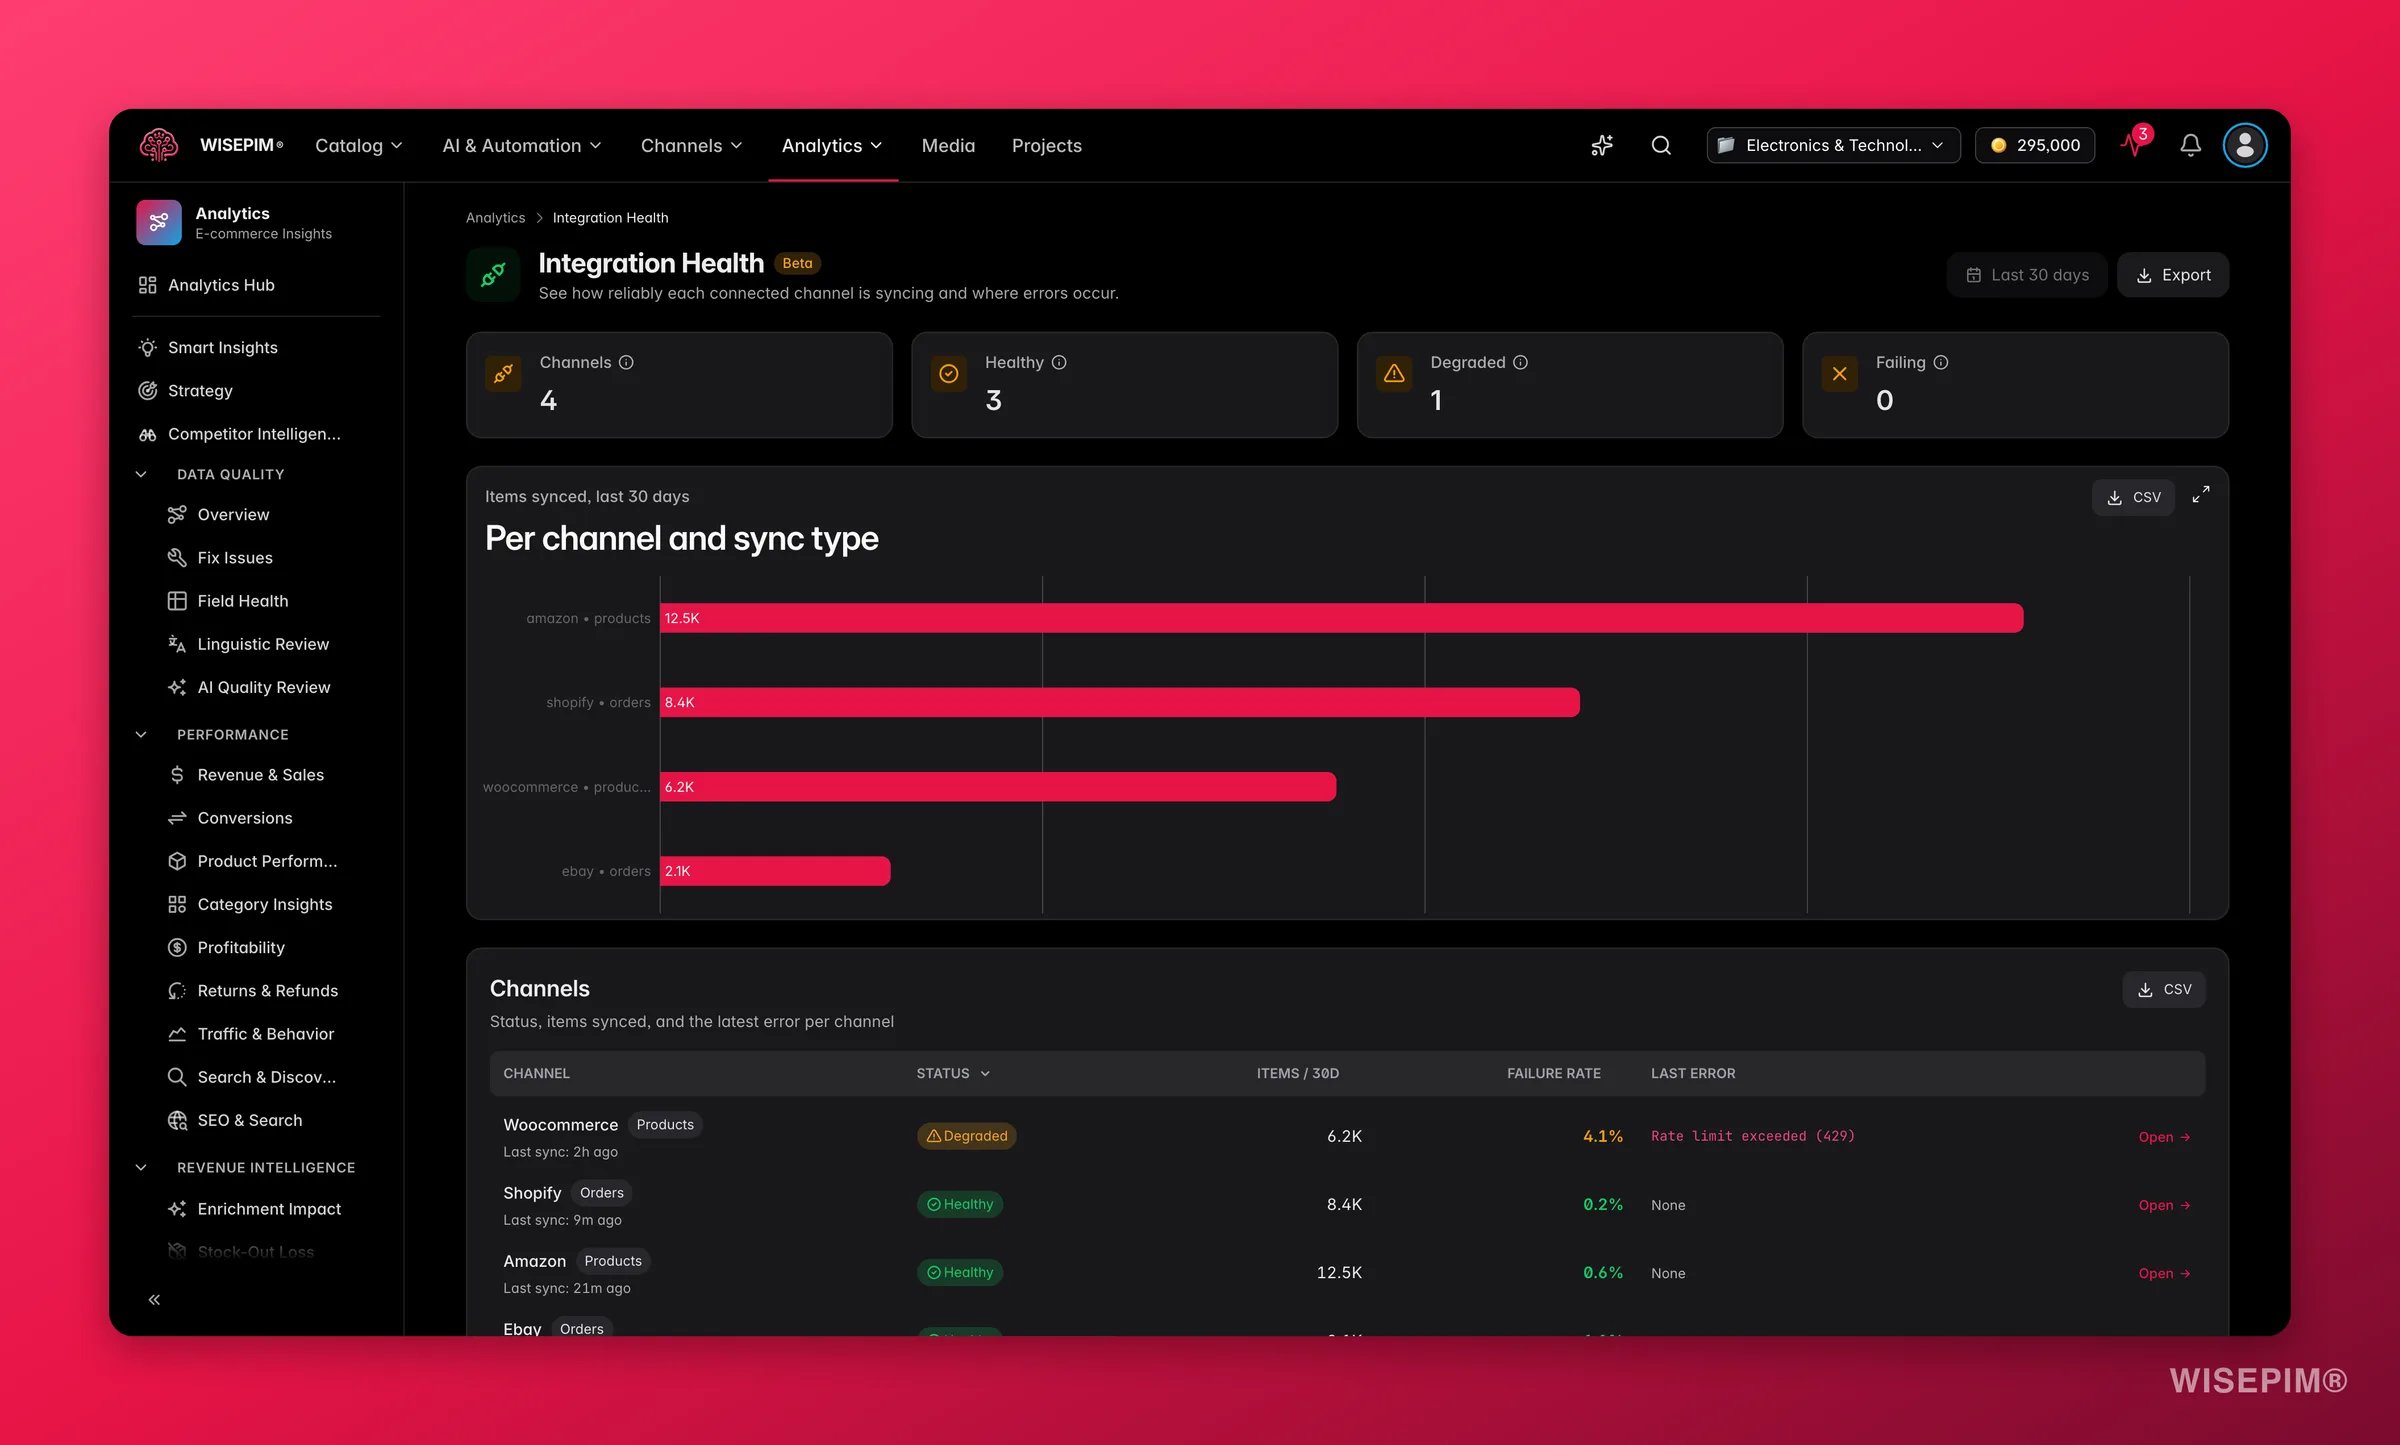
The stop that catches silent failures, and the one place you break the read-only rule. [Integration Health](/en/analytics/integration-health) lists every connected channel with its last sync, failure rate, and last error. Under 3% failure over 30 days is healthy; 3–10% is amber and worth investigating; 10% or more is red and means customers are seeing stale prices, stock, or content right now. The **Last error** column is your diagnosis - it usually says outright whether a token expired or a product was rejected.
Start at the [Overview](/en/overview). Read the health score and its trend, then the daily briefing, then skim the action queue, which is already ranked by how much each gap moves your score. A drop since last week almost always traces back to an import or a sync that brought in incomplete data, and the recent-activity feed will name it.
Open [Smart Insights](/en/analytics/smart-insights). Its rollup splits everything into money you are losing to a fixable cause, metrics heading the wrong way, and upside worth chasing. A large recoverable total spread over only a handful of SKUs is the highest-value thing on your screen this morning; note it and move on.
Read **What changed since last analysis** on [Competitor Intelligence](/en/analytics/competitors), then the **Start here** card: it names your single highest-impact move with impact and effort chips, so you can judge it in seconds. Note it - it is a strong candidate for the build at the end of the round.
The stop that catches silent failures, and the one place you break the read-only rule. [Integration Health](/en/analytics/integration-health) lists every connected channel with its last sync, failure rate, and last error. Under 3% failure over 30 days is healthy; 3–10% is amber and worth investigating; 10% or more is red and means customers are seeing stale prices, stock, or content right now. The **Last error** column is your diagnosis - it usually says outright whether a token expired or a product was rejected.
 ## Clear the queues - about 20 minutes
Now act, in this order: the queue that is actively blocking revenue first, then the counts, then the two systems that fail without telling you. This is the housekeeping that stops small problems compounding into the score drop you would otherwise read about next Monday.
## Clear the queues - about 20 minutes
Now act, in this order: the queue that is actively blocking revenue first, then the counts, then the two systems that fail without telling you. This is the housekeeping that stops small problems compounding into the score drop you would otherwise read about next Monday.
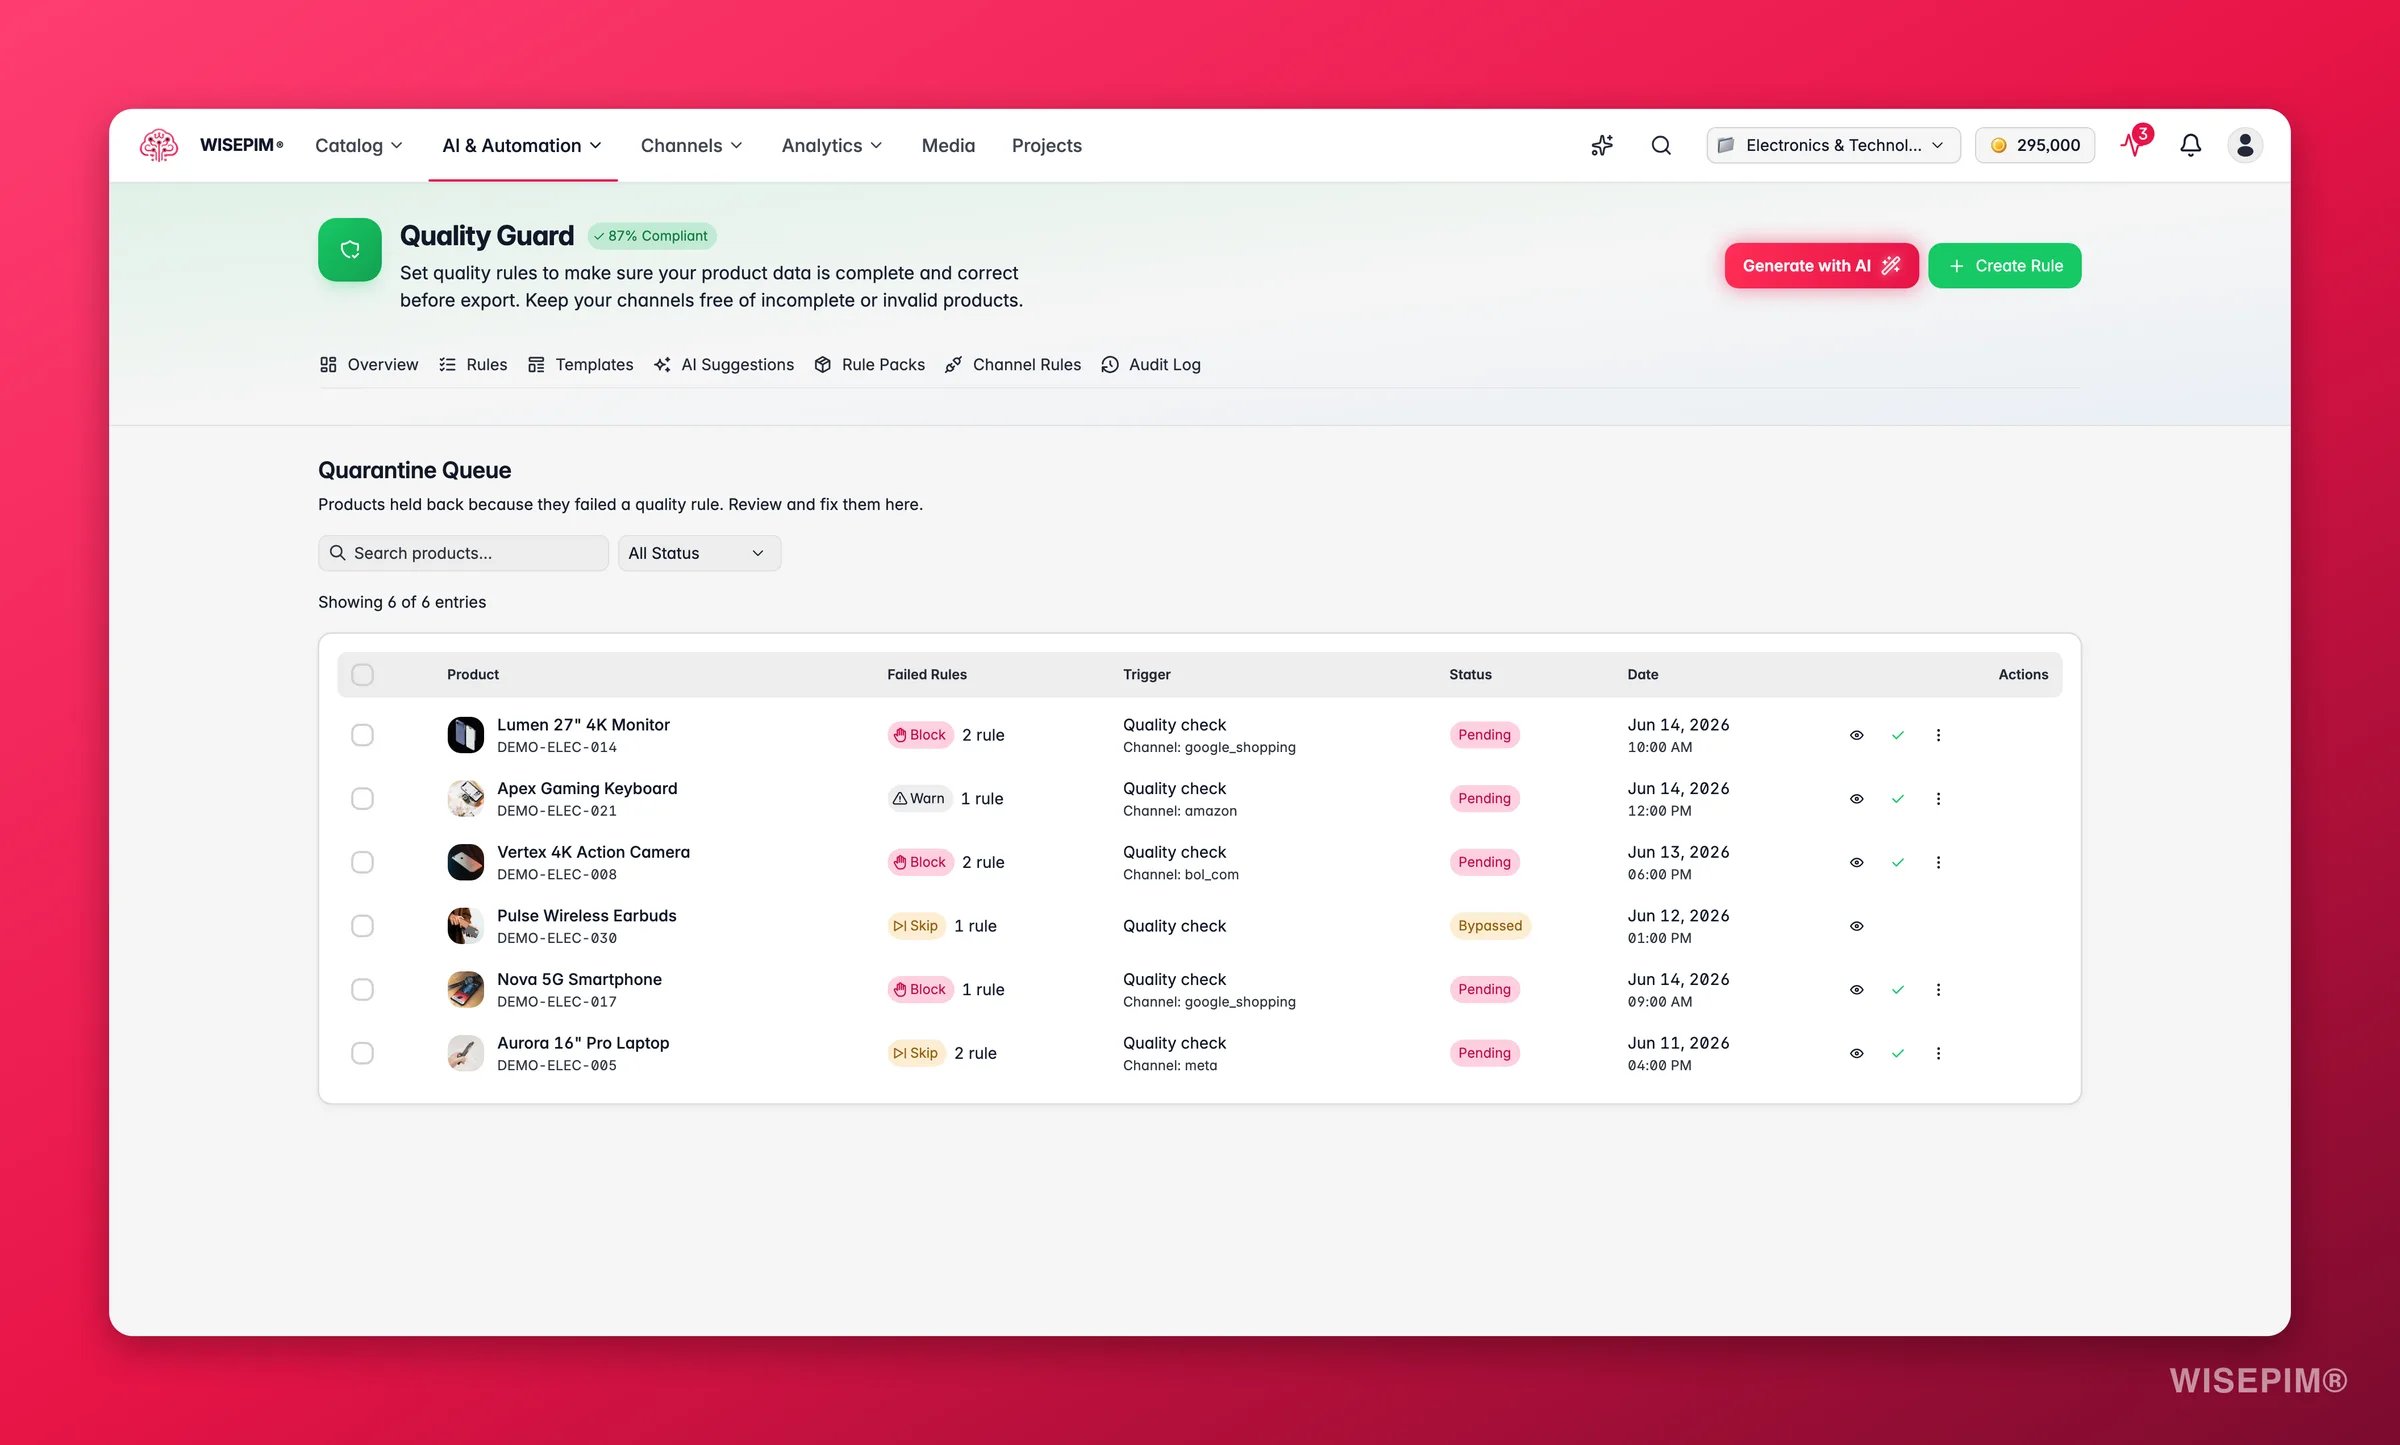
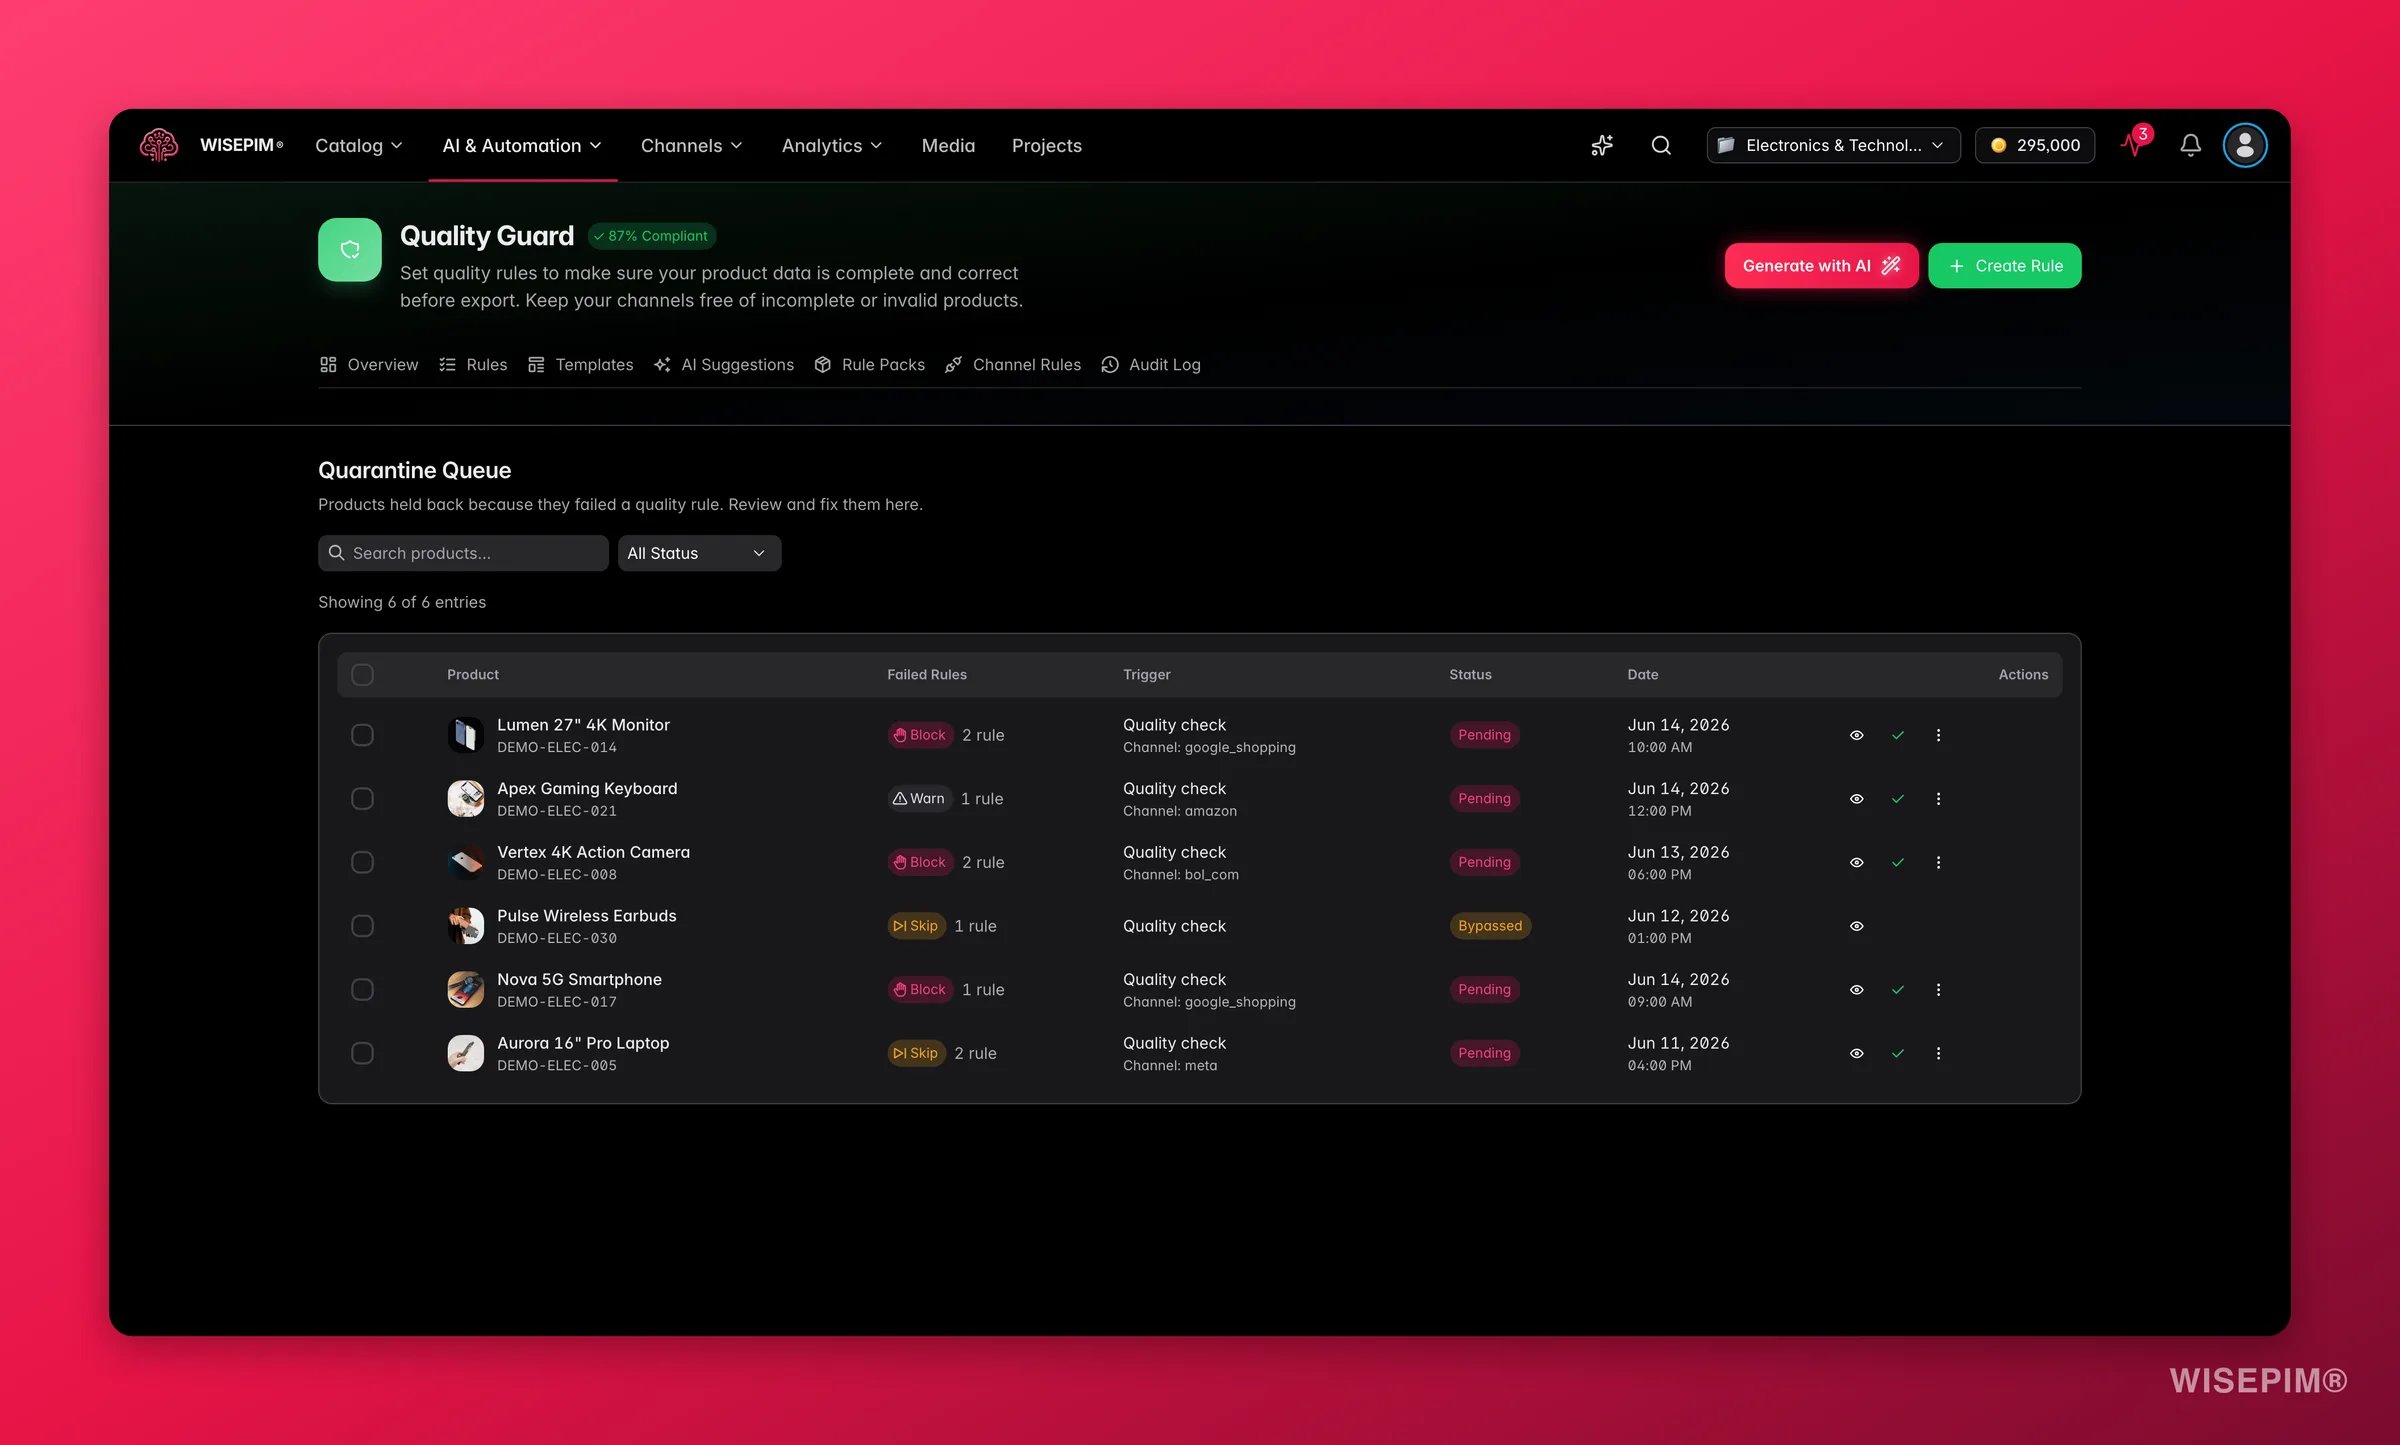 Nothing in [quarantine](/en/quality-guard/quarantine) can be exported, synced, or published, so every entry is a product not earning. Open each one to see the field, the expected value, and the actual value, fix the data, and resolve. After a bulk fix, use bulk resolve to clear the affected entries in one go rather than clicking through them.
On the Products page, open the [filter modal](/en/products/filtering-products) and go to the **Presets** tab. Each preset card carries a live count, so the **Quick Fixes** group - low quality, unreviewed, no image, no category - works as a weekly scoreboard. Compare against last week and work only the one that grew; the others can wait a week without costing you anything.
In [Feed Hub](/en/essentials/feed-hub), open each main feed, click **Recalculate** on the Feed Quality panel, and read which of the six dimensions is weakest. Then open **Generation History**, select the two most recent versions, and click **Compare**. An unexpected drop in product count is the cheapest problem you will ever catch, and it is invisible on every other screen in this routine.
Open the [automations dashboard](/en/automations/overview) and scan the success rate on every workflow whose status is **Active**. Anything below 80 % needs **View History** opened, because unlike a manual job, a failing automation never tells you it stopped working - it just quietly stops doing the thing you stopped doing by hand.
## Finish with one build - the rest of the hour
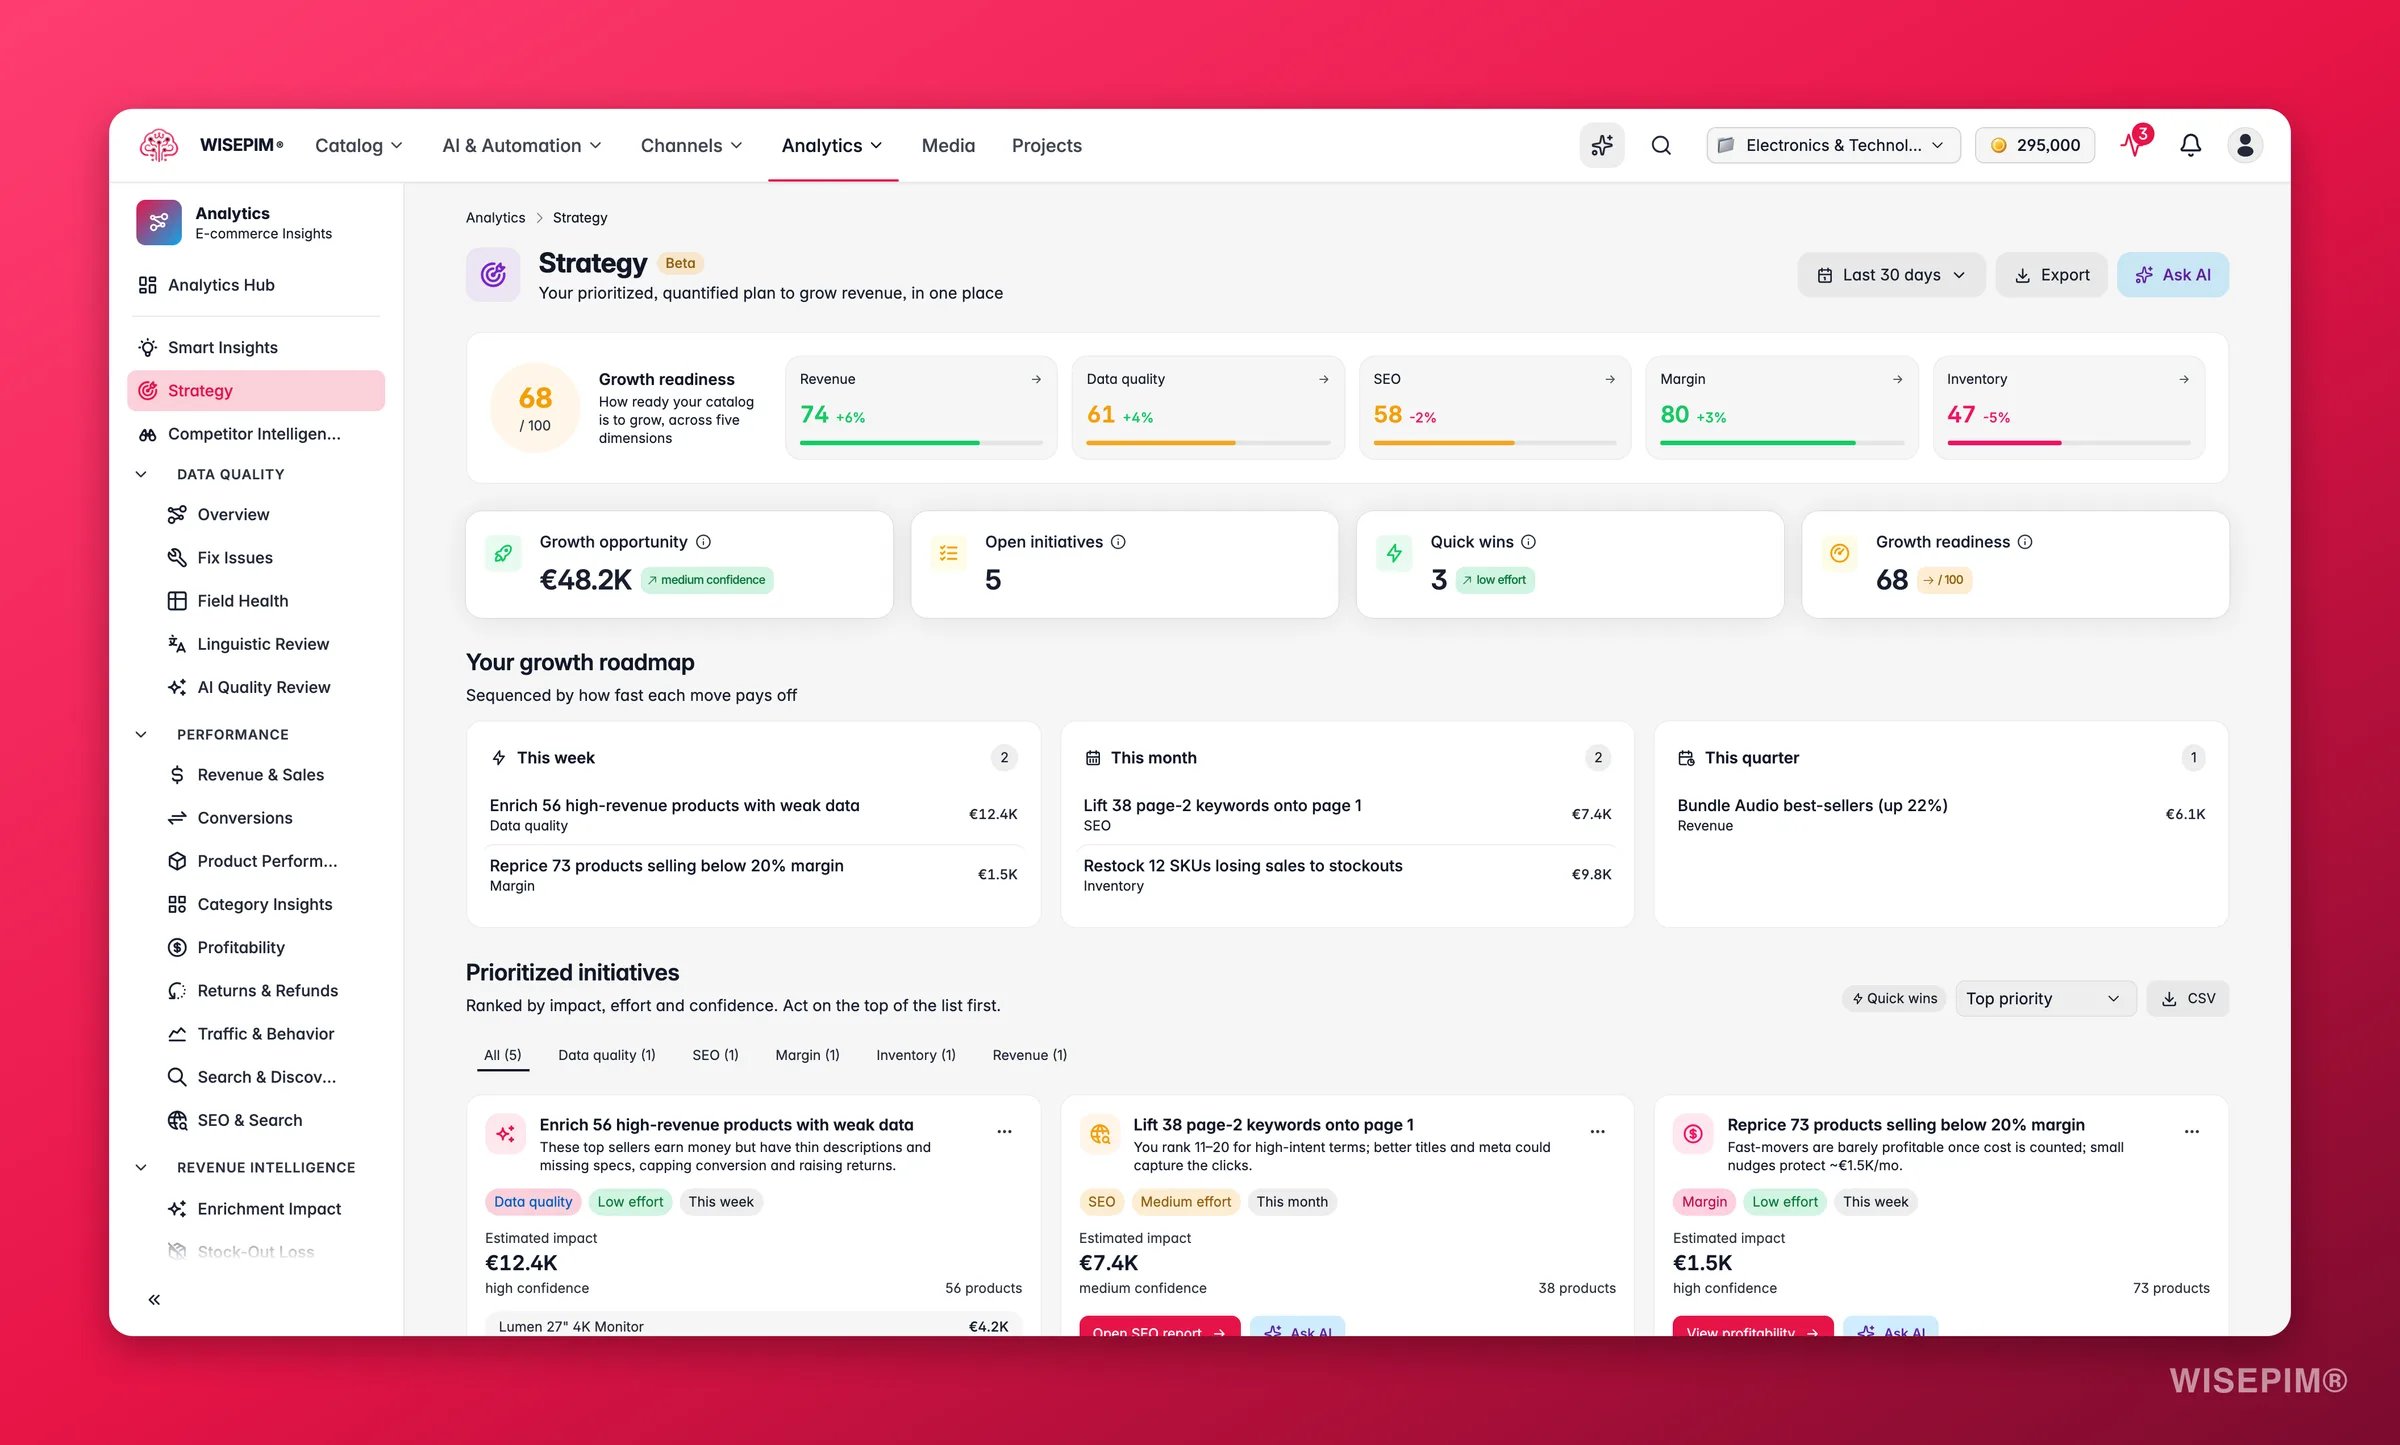
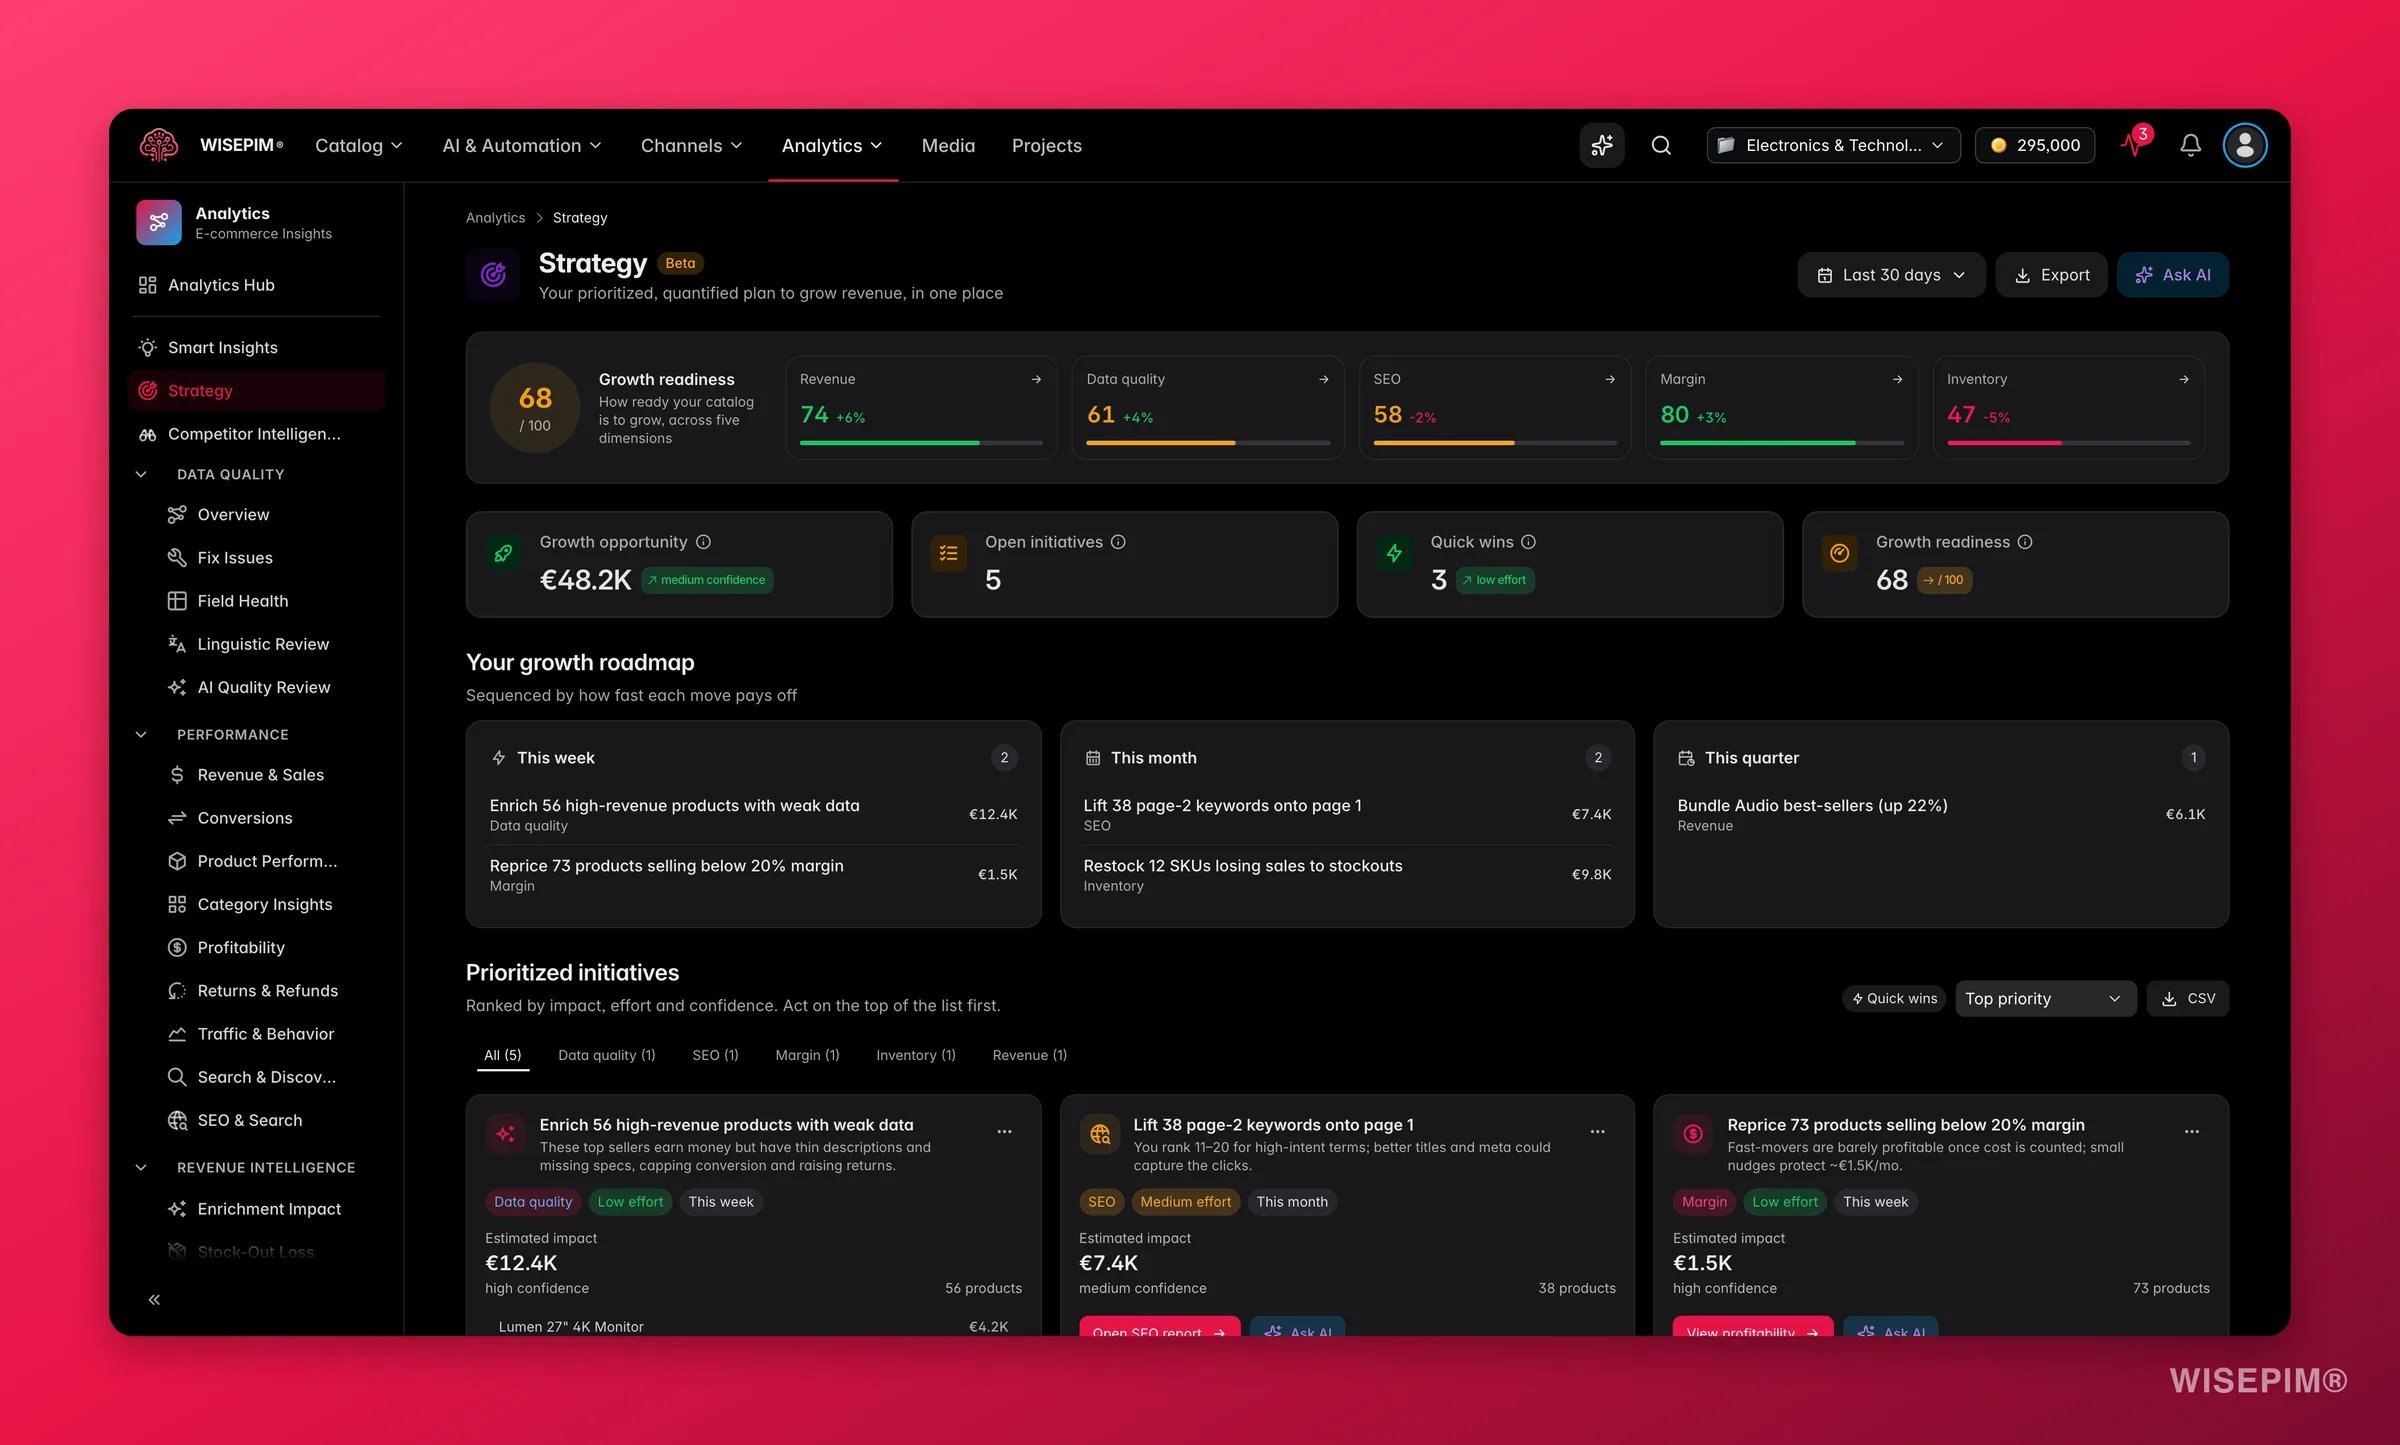
The time you have left goes into building something, not reading a tenth dashboard. Open the [Strategy](/en/analytics/strategy) report, toggle **Quick wins only**, and ship exactly one initiative from the top. Each opens a drawer with the estimated revenue impact and its confidence, the affected products, and a one-click action that starts the work. Pick the one that matches what stops 1 to 4 told you, and close it before you open another.
Nothing in [quarantine](/en/quality-guard/quarantine) can be exported, synced, or published, so every entry is a product not earning. Open each one to see the field, the expected value, and the actual value, fix the data, and resolve. After a bulk fix, use bulk resolve to clear the affected entries in one go rather than clicking through them.
On the Products page, open the [filter modal](/en/products/filtering-products) and go to the **Presets** tab. Each preset card carries a live count, so the **Quick Fixes** group - low quality, unreviewed, no image, no category - works as a weekly scoreboard. Compare against last week and work only the one that grew; the others can wait a week without costing you anything.
In [Feed Hub](/en/essentials/feed-hub), open each main feed, click **Recalculate** on the Feed Quality panel, and read which of the six dimensions is weakest. Then open **Generation History**, select the two most recent versions, and click **Compare**. An unexpected drop in product count is the cheapest problem you will ever catch, and it is invisible on every other screen in this routine.
Open the [automations dashboard](/en/automations/overview) and scan the success rate on every workflow whose status is **Active**. Anything below 80 % needs **View History** opened, because unlike a manual job, a failing automation never tells you it stopped working - it just quietly stops doing the thing you stopped doing by hand.
## Finish with one build - the rest of the hour
The time you have left goes into building something, not reading a tenth dashboard. Open the [Strategy](/en/analytics/strategy) report, toggle **Quick wins only**, and ship exactly one initiative from the top. Each opens a drawer with the estimated revenue impact and its confidence, the affected products, and a one-click action that starts the work. Pick the one that matches what stops 1 to 4 told you, and close it before you open another.
 One quick win a week beats one big audit a quarter. If an initiative keeps coming back, like enriching every newly imported product, stop shipping it by hand and [wire it to an automation](/en/guides/automate-your-enrichment-pipeline) instead.
## How to tell it worked
A healthy week looks unremarkable: every channel green, the quarantine queue empty, and a catalog score that is flat or slightly up. Drama is the signal, not the numbers themselves. Run the round three or four times and the week-over-week deltas start doing the work for you, because by then you know what normal looks like.
This is the table to keep. Work it top to bottom.
| Stop | What you read there | What good looks like |
| ------------------------------------------------------------- | ------------------------------------------------------------- | -------------------------------------------------------------------------- |
| 1. **[Overview](/en/overview)** | Health score and trend, daily briefing, ranked action queue | Trend flat or rising, no unexplained overnight drop |
| 2. **[Smart Insights](/en/analytics/smart-insights)** | Recoverable, at risk, and upside totals | Recoverable total smaller than last week |
| 3. **[Competitor Intelligence](/en/analytics/competitors)** | What changed since last analysis, and the **Start here** card | Fresh Monday analysis, and last week's **Start here** fix actually applied |
| 4. **[Integration Health](/en/analytics/integration-health)** | Last sync, failure rate, and last error per channel | Every channel healthy, none under 3 % failure, none last synced days ago |
| 5. **[Quarantine](/en/quality-guard/quarantine)** | Products held back and the field that held them | Zero pending entries when you close the tab |
| 6. **[Filter presets](/en/products/filtering-products)** | Live counts on the Quick Fixes preset cards | Counts falling, or at minimum not growing |
| 7. **[Feed Hub](/en/essentials/feed-hub)** | Weakest quality dimension, and the last-two-generations diff | Product count between the last two generations matches what you expect |
| 8. **[Automations](/en/automations/overview)** | Success rate on every active workflow | Every active workflow at or above 80 % |
| 9. **[Strategy](/en/analytics/strategy)** | Quick wins, ranked by impact against effort | One initiative closed, not five opened |
If stops 1 to 4 turn up nothing and stops 5 to 8 are already clean, finish early. The routine is a check, not a quota.
## When it doesn't work
You are fixing during the reading half. Keep stops 1 to 4 read-only - write findings down instead of acting on them, and let those notes decide where the clearing time goes. Everything on the Overview action queue and in Strategy is already ranked by impact, so working top-down and stopping when the hour is up is the cheapest possible way to run out of time.
You are treating symptoms. One root cause often breaks several rules at once, so fix the underlying field and then **Bulk Resolve** the entries it cleared, rather than clicking through them one by one. For entries that are genuine, permanent exceptions, **Bypass** with a written reason so they stop reappearing - the reason is kept in the [audit log](/en/quality-guard/audit-log). If you find yourself bypassing the same rule every week, the rule or the incoming data needs changing, not the entries.
Start with the credentials. A failure rate that climbs gradually into the 3–10 % band is the classic signature of an expired token or a rotated API key, and the error is usually a 401 or 403; re-test the connection from [Integrations](/en/integrations/supported-platforms). If the error names a field instead, the channel is rejecting products for missing data - fill it with a bulk edit today, then write the [Quality Guard](/en/quality-guard/overview) rule that stops it recurring. If several channels went amber in the same week, suspect one upstream cause, usually a bulk import that landed products missing a required field.
One of your competitors blocked the scrape. The message names which shops could not be read, and the rest of the analysis is still valid. Try that competitor again on the next run, or spend the slot on a rival you actually lose deals to. See [Competitor Intelligence](/en/analytics/competitors).
Check the recent-activity feed on the [Overview](/en/overview) for an import or sync around the time of the drop, then open the [Process Tracker](/en/other-features/process-tracker) to see what that job actually did. A batch of thin products arriving at once is the usual cause, and the action queue will already list the gaps they introduced.
## Related
The health score, daily briefing, and ranked action queue this routine starts from.
One ranked feed of what changed and why, with an action on every signal.
Take the parts of this round that repeat every week and hand them to an automation.
Do this first if your Monday round keeps surfacing the same structural mess.
One quick win a week beats one big audit a quarter. If an initiative keeps coming back, like enriching every newly imported product, stop shipping it by hand and [wire it to an automation](/en/guides/automate-your-enrichment-pipeline) instead.
## How to tell it worked
A healthy week looks unremarkable: every channel green, the quarantine queue empty, and a catalog score that is flat or slightly up. Drama is the signal, not the numbers themselves. Run the round three or four times and the week-over-week deltas start doing the work for you, because by then you know what normal looks like.
This is the table to keep. Work it top to bottom.
| Stop | What you read there | What good looks like |
| ------------------------------------------------------------- | ------------------------------------------------------------- | -------------------------------------------------------------------------- |
| 1. **[Overview](/en/overview)** | Health score and trend, daily briefing, ranked action queue | Trend flat or rising, no unexplained overnight drop |
| 2. **[Smart Insights](/en/analytics/smart-insights)** | Recoverable, at risk, and upside totals | Recoverable total smaller than last week |
| 3. **[Competitor Intelligence](/en/analytics/competitors)** | What changed since last analysis, and the **Start here** card | Fresh Monday analysis, and last week's **Start here** fix actually applied |
| 4. **[Integration Health](/en/analytics/integration-health)** | Last sync, failure rate, and last error per channel | Every channel healthy, none under 3 % failure, none last synced days ago |
| 5. **[Quarantine](/en/quality-guard/quarantine)** | Products held back and the field that held them | Zero pending entries when you close the tab |
| 6. **[Filter presets](/en/products/filtering-products)** | Live counts on the Quick Fixes preset cards | Counts falling, or at minimum not growing |
| 7. **[Feed Hub](/en/essentials/feed-hub)** | Weakest quality dimension, and the last-two-generations diff | Product count between the last two generations matches what you expect |
| 8. **[Automations](/en/automations/overview)** | Success rate on every active workflow | Every active workflow at or above 80 % |
| 9. **[Strategy](/en/analytics/strategy)** | Quick wins, ranked by impact against effort | One initiative closed, not five opened |
If stops 1 to 4 turn up nothing and stops 5 to 8 are already clean, finish early. The routine is a check, not a quota.
## When it doesn't work
You are fixing during the reading half. Keep stops 1 to 4 read-only - write findings down instead of acting on them, and let those notes decide where the clearing time goes. Everything on the Overview action queue and in Strategy is already ranked by impact, so working top-down and stopping when the hour is up is the cheapest possible way to run out of time.
You are treating symptoms. One root cause often breaks several rules at once, so fix the underlying field and then **Bulk Resolve** the entries it cleared, rather than clicking through them one by one. For entries that are genuine, permanent exceptions, **Bypass** with a written reason so they stop reappearing - the reason is kept in the [audit log](/en/quality-guard/audit-log). If you find yourself bypassing the same rule every week, the rule or the incoming data needs changing, not the entries.
Start with the credentials. A failure rate that climbs gradually into the 3–10 % band is the classic signature of an expired token or a rotated API key, and the error is usually a 401 or 403; re-test the connection from [Integrations](/en/integrations/supported-platforms). If the error names a field instead, the channel is rejecting products for missing data - fill it with a bulk edit today, then write the [Quality Guard](/en/quality-guard/overview) rule that stops it recurring. If several channels went amber in the same week, suspect one upstream cause, usually a bulk import that landed products missing a required field.
One of your competitors blocked the scrape. The message names which shops could not be read, and the rest of the analysis is still valid. Try that competitor again on the next run, or spend the slot on a rival you actually lose deals to. See [Competitor Intelligence](/en/analytics/competitors).
Check the recent-activity feed on the [Overview](/en/overview) for an import or sync around the time of the drop, then open the [Process Tracker](/en/other-features/process-tracker) to see what that job actually did. A batch of thin products arriving at once is the usual cause, and the action queue will already list the gaps they introduced.
## Related
The health score, daily briefing, and ranked action queue this routine starts from.
One ranked feed of what changed and why, with an action on every signal.
Take the parts of this round that repeat every week and hand them to an automation.
Do this first if your Monday round keeps surfacing the same structural mess.