> ## Documentation Index
> Fetch the complete documentation index at: https://docs.wisepim.com/llms.txt
> Use this file to discover all available pages before exploring further.
# Traffic & Behavior
> See who visits your store, where they come from, and what they do once they arrive. Focus on attracting the right visitors, not just more of them.
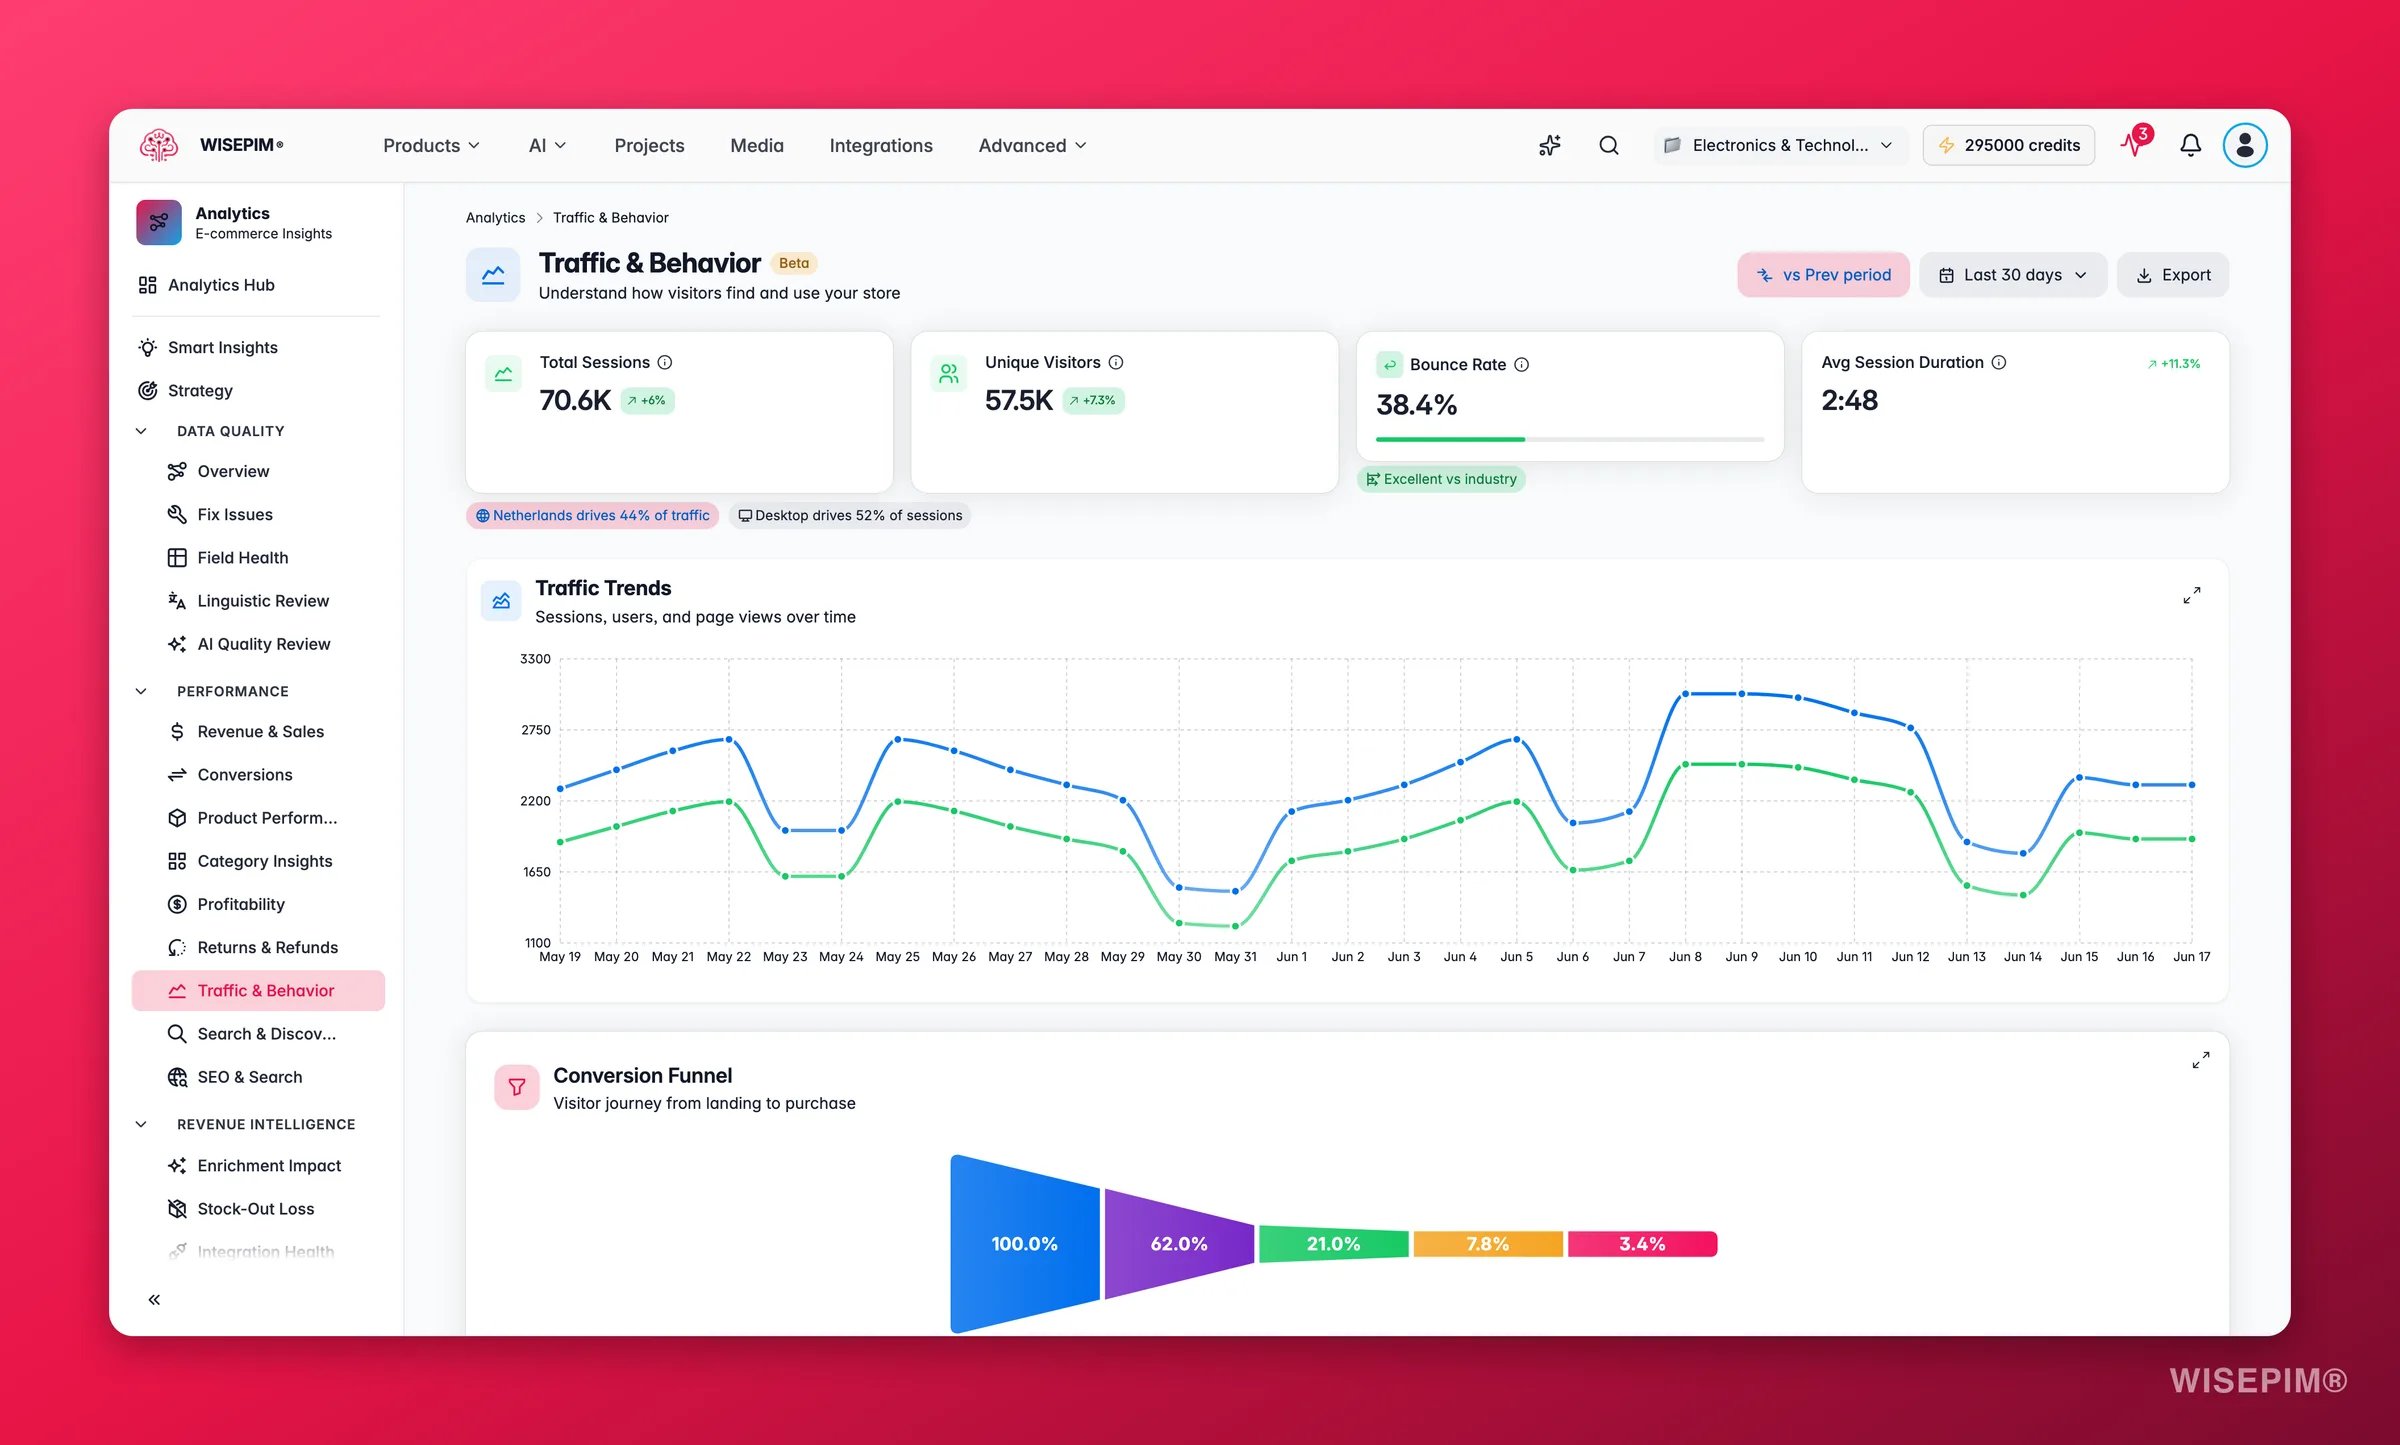
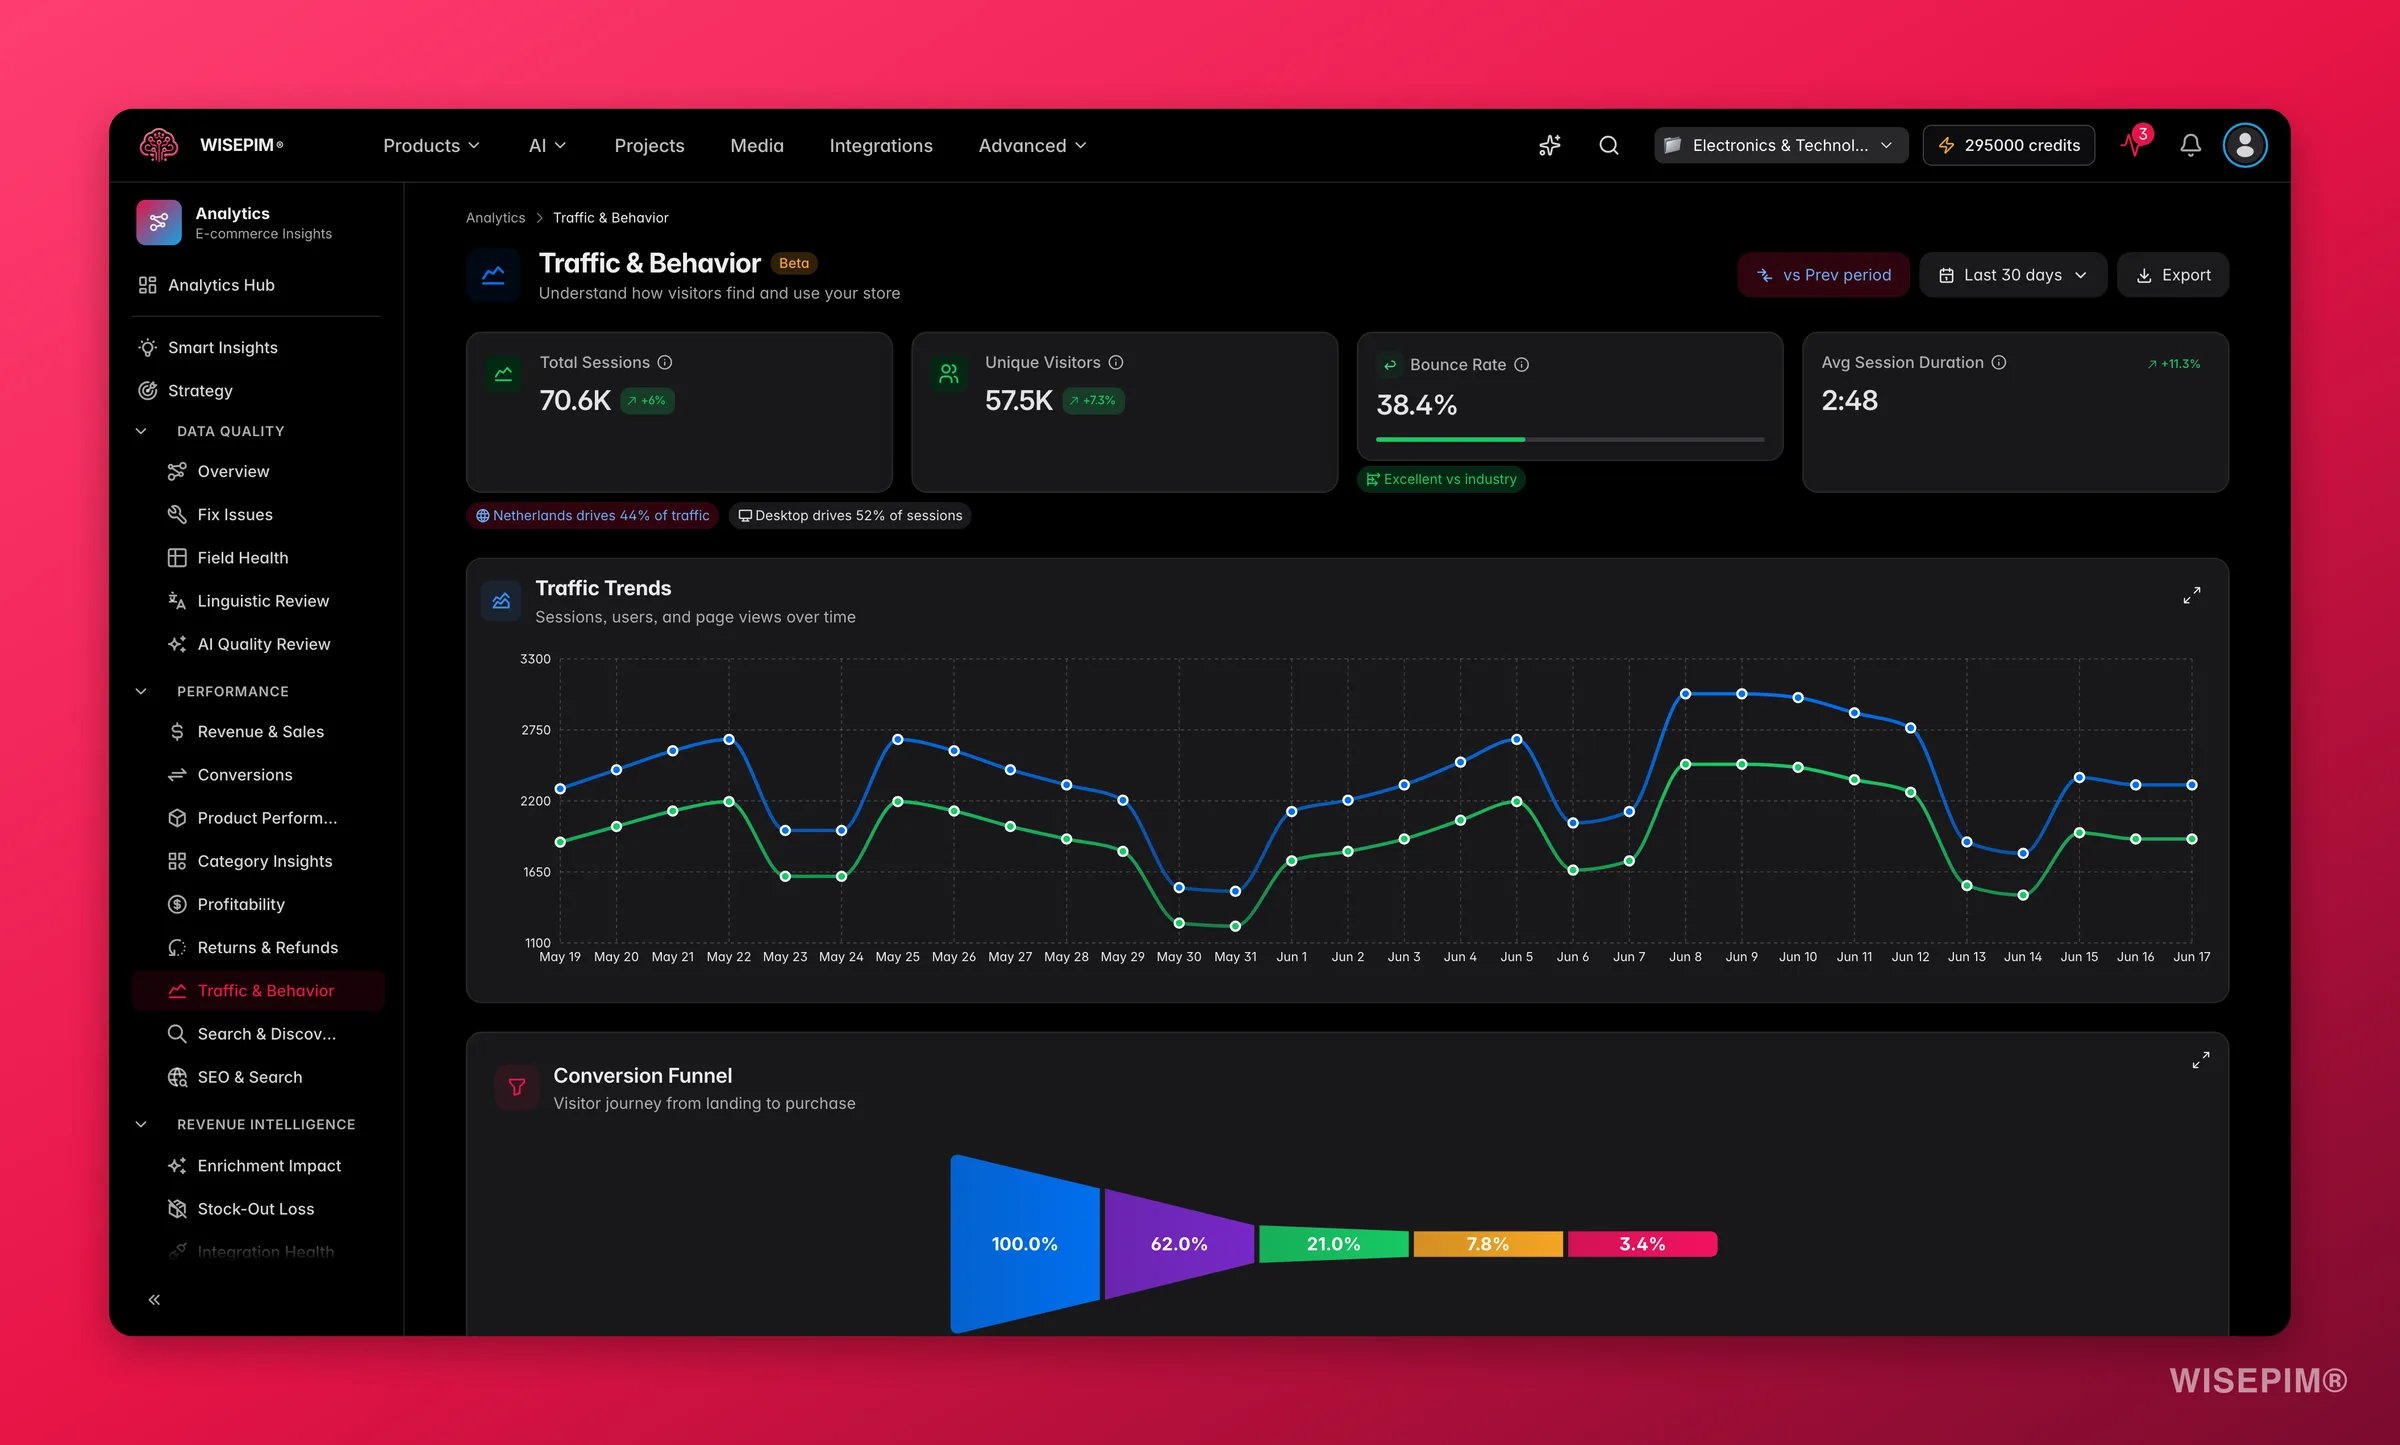 Traffic & Behavior shows you who visits your store, where they come from, and what they do once they arrive. It links traffic volume to engagement quality, so you can focus on attracting the right visitors, not just more visitors.
Acting on this report typically means fixing the entry points that leak visitors, bad landing pages, mis-targeted campaigns, or a mobile checkout that underperforms on desktop, and redirecting attention toward the sources that already convert well.
At its core, the report works on order-based traffic data from your connected platform. When you connect **Google Analytics 4**, the report unlocks far richer behavioral data, a "GA4 powered" badge appears next to the relevant sections. GA4 adds session-level metrics, new vs returning visitor data, a full traffic trend over time, and a behavioral conversion funnel. How much you see without GA4 depends on what your platform exposes.
## Key metrics
These metrics tell you how healthy your traffic is.
| Metric | What it measures |
| ---------------------------- | ---------------------------------------------------------------------------------------------------------------------------------- |
| **Sessions** | Total visits to your store in the selected period. |
| **Unique visitors** | Distinct people who visited. One person can have several sessions. |
| **Bounce rate** | Share of sessions where the visitor left after one page. A high rate means visitors did not find what they expected. |
| **Average session duration** | How long visitors spend per session. |
| **Pages per session** | Average pages viewed per session, derived as total page views divided by total sessions. More pages usually means more engagement. |
Bounce rate alone does not tell the whole story. A high bounce rate on a product page can be fine if visitors find what they need fast. Read it alongside session duration for a clearer picture.
## Traffic trend over time
When GA4 is connected, a trend chart shows sessions, users, and page views plotted over the selected period. This gives you a time-series view of whether traffic is growing, stable, or in decline, and whether a dip is in raw visits, distinct users, or content engagement. Without GA4, platform-level order data informs the overview numbers but does not produce this chart.
## New vs returning visitors
GA4 also surfaces the split between new and returning visitors as a dedicated breakdown. New visitors represent acquisition; returning visitors represent retention and loyalty.
| Split | What it signals |
| ------------------------------- | -------------------------------------------------------------------------------------------------------------------------- |
| New visitors > 80% | Heavy acquisition mode, good for a launch, but unsustainable long-term. Focus on turning first visits into repeat ones. |
| Returning visitors > 50% | Strong retention, your loyal base is active. Check that you are also investing enough in acquisition to grow the audience. |
| Roughly 60% new / 40% returning | A balanced, healthy store. Returning visitors typically convert at 2–3× the rate of new ones. |
This breakdown is only available when GA4 is connected.
## Read the charts
The report breaks your traffic down from several angles. Each view answers a different question.
| View | What it shows | Use it to |
| ---------------------- | --------------------------------------------------------------------------------------------------------------------------------------------------------------------------------------------------------------------------------------------------------------------------------------------------------------------------------- | -------------------------------------------------------- |
| **Traffic sparklines** | A compact trend line per metric. Green means improvement, red means decline. | Get an instant health check without digging into detail. |
| **Bounce rate status** | Your current bounce rate with a color-coded rating and a benchmark badge (Excellent \<40%, Typical 40–55%, High >55%). | Spot when bounce rate needs attention at a glance. |
| **Traffic by source** | Sessions split by source and medium (e.g. google, facebook, direct, email). Each source also shows its conversion rate, so you can distinguish high-volume channels from high-quality ones. Organic search (google/organic) typically converts at 2–4%, paid search (google/cpc) at 1–3%, and social at under 1% for most stores. | Judge which channels deserve more investment. |
| **Traffic by device** | A donut split by desktop, mobile, and tablet. | Decide where to optimize the shopping experience first. |
| **Traffic by country** | Your top visitor countries. A concentration chip appears when a single country accounts for 20% or more of sessions. | Spot international demand and weigh localized content. |
Concentration insight chips surface automatically when your traffic is skewed in ways worth knowing: one country driving 20%+ of sessions, or one device class driving 40%+ of sessions. Both can point to opportunities or risks depending on whether those segments are converting well.
### Conversion funnel
A five-stage funnel shows how traffic progresses from arrival to purchase: Landing → Product View → Add to Cart → Checkout → Purchase. Each stage shows the session count and the drop-off percentage to the next step. The steepest drop is the stage most worth optimising.
Typical e-commerce drop-off patterns to watch for:
* **Landing → Product View drop > 70%**: your landing pages are not guiding visitors to products. Improve category pages, featured collections, or search.
* **Product View → Add to Cart drop > 90%**: product pages lack persuasion, review descriptions, images, and pricing.
* **Add to Cart → Checkout drop > 60%**: cart abandonment is high. Look at shipping costs, forced account creation, or cart page load speed.
* **Checkout → Purchase drop > 40%**: something in checkout is failing, payment options, trust signals, or form errors.
This funnel complements the order-based funnel in [Conversions](/en/analytics/conversions) and the GA4 behavioral funnel available there when GA4 is connected.
### Page-level insights
Traffic & Behavior shows you who visits your store, where they come from, and what they do once they arrive. It links traffic volume to engagement quality, so you can focus on attracting the right visitors, not just more visitors.
Acting on this report typically means fixing the entry points that leak visitors, bad landing pages, mis-targeted campaigns, or a mobile checkout that underperforms on desktop, and redirecting attention toward the sources that already convert well.
At its core, the report works on order-based traffic data from your connected platform. When you connect **Google Analytics 4**, the report unlocks far richer behavioral data, a "GA4 powered" badge appears next to the relevant sections. GA4 adds session-level metrics, new vs returning visitor data, a full traffic trend over time, and a behavioral conversion funnel. How much you see without GA4 depends on what your platform exposes.
## Key metrics
These metrics tell you how healthy your traffic is.
| Metric | What it measures |
| ---------------------------- | ---------------------------------------------------------------------------------------------------------------------------------- |
| **Sessions** | Total visits to your store in the selected period. |
| **Unique visitors** | Distinct people who visited. One person can have several sessions. |
| **Bounce rate** | Share of sessions where the visitor left after one page. A high rate means visitors did not find what they expected. |
| **Average session duration** | How long visitors spend per session. |
| **Pages per session** | Average pages viewed per session, derived as total page views divided by total sessions. More pages usually means more engagement. |
Bounce rate alone does not tell the whole story. A high bounce rate on a product page can be fine if visitors find what they need fast. Read it alongside session duration for a clearer picture.
## Traffic trend over time
When GA4 is connected, a trend chart shows sessions, users, and page views plotted over the selected period. This gives you a time-series view of whether traffic is growing, stable, or in decline, and whether a dip is in raw visits, distinct users, or content engagement. Without GA4, platform-level order data informs the overview numbers but does not produce this chart.
## New vs returning visitors
GA4 also surfaces the split between new and returning visitors as a dedicated breakdown. New visitors represent acquisition; returning visitors represent retention and loyalty.
| Split | What it signals |
| ------------------------------- | -------------------------------------------------------------------------------------------------------------------------- |
| New visitors > 80% | Heavy acquisition mode, good for a launch, but unsustainable long-term. Focus on turning first visits into repeat ones. |
| Returning visitors > 50% | Strong retention, your loyal base is active. Check that you are also investing enough in acquisition to grow the audience. |
| Roughly 60% new / 40% returning | A balanced, healthy store. Returning visitors typically convert at 2–3× the rate of new ones. |
This breakdown is only available when GA4 is connected.
## Read the charts
The report breaks your traffic down from several angles. Each view answers a different question.
| View | What it shows | Use it to |
| ---------------------- | --------------------------------------------------------------------------------------------------------------------------------------------------------------------------------------------------------------------------------------------------------------------------------------------------------------------------------- | -------------------------------------------------------- |
| **Traffic sparklines** | A compact trend line per metric. Green means improvement, red means decline. | Get an instant health check without digging into detail. |
| **Bounce rate status** | Your current bounce rate with a color-coded rating and a benchmark badge (Excellent \<40%, Typical 40–55%, High >55%). | Spot when bounce rate needs attention at a glance. |
| **Traffic by source** | Sessions split by source and medium (e.g. google, facebook, direct, email). Each source also shows its conversion rate, so you can distinguish high-volume channels from high-quality ones. Organic search (google/organic) typically converts at 2–4%, paid search (google/cpc) at 1–3%, and social at under 1% for most stores. | Judge which channels deserve more investment. |
| **Traffic by device** | A donut split by desktop, mobile, and tablet. | Decide where to optimize the shopping experience first. |
| **Traffic by country** | Your top visitor countries. A concentration chip appears when a single country accounts for 20% or more of sessions. | Spot international demand and weigh localized content. |
Concentration insight chips surface automatically when your traffic is skewed in ways worth knowing: one country driving 20%+ of sessions, or one device class driving 40%+ of sessions. Both can point to opportunities or risks depending on whether those segments are converting well.
### Conversion funnel
A five-stage funnel shows how traffic progresses from arrival to purchase: Landing → Product View → Add to Cart → Checkout → Purchase. Each stage shows the session count and the drop-off percentage to the next step. The steepest drop is the stage most worth optimising.
Typical e-commerce drop-off patterns to watch for:
* **Landing → Product View drop > 70%**: your landing pages are not guiding visitors to products. Improve category pages, featured collections, or search.
* **Product View → Add to Cart drop > 90%**: product pages lack persuasion, review descriptions, images, and pricing.
* **Add to Cart → Checkout drop > 60%**: cart abandonment is high. Look at shipping costs, forced account creation, or cart page load speed.
* **Checkout → Purchase drop > 40%**: something in checkout is failing, payment options, trust signals, or form errors.
This funnel complements the order-based funnel in [Conversions](/en/analytics/conversions) and the GA4 behavioral funnel available there when GA4 is connected.
### Page-level insights
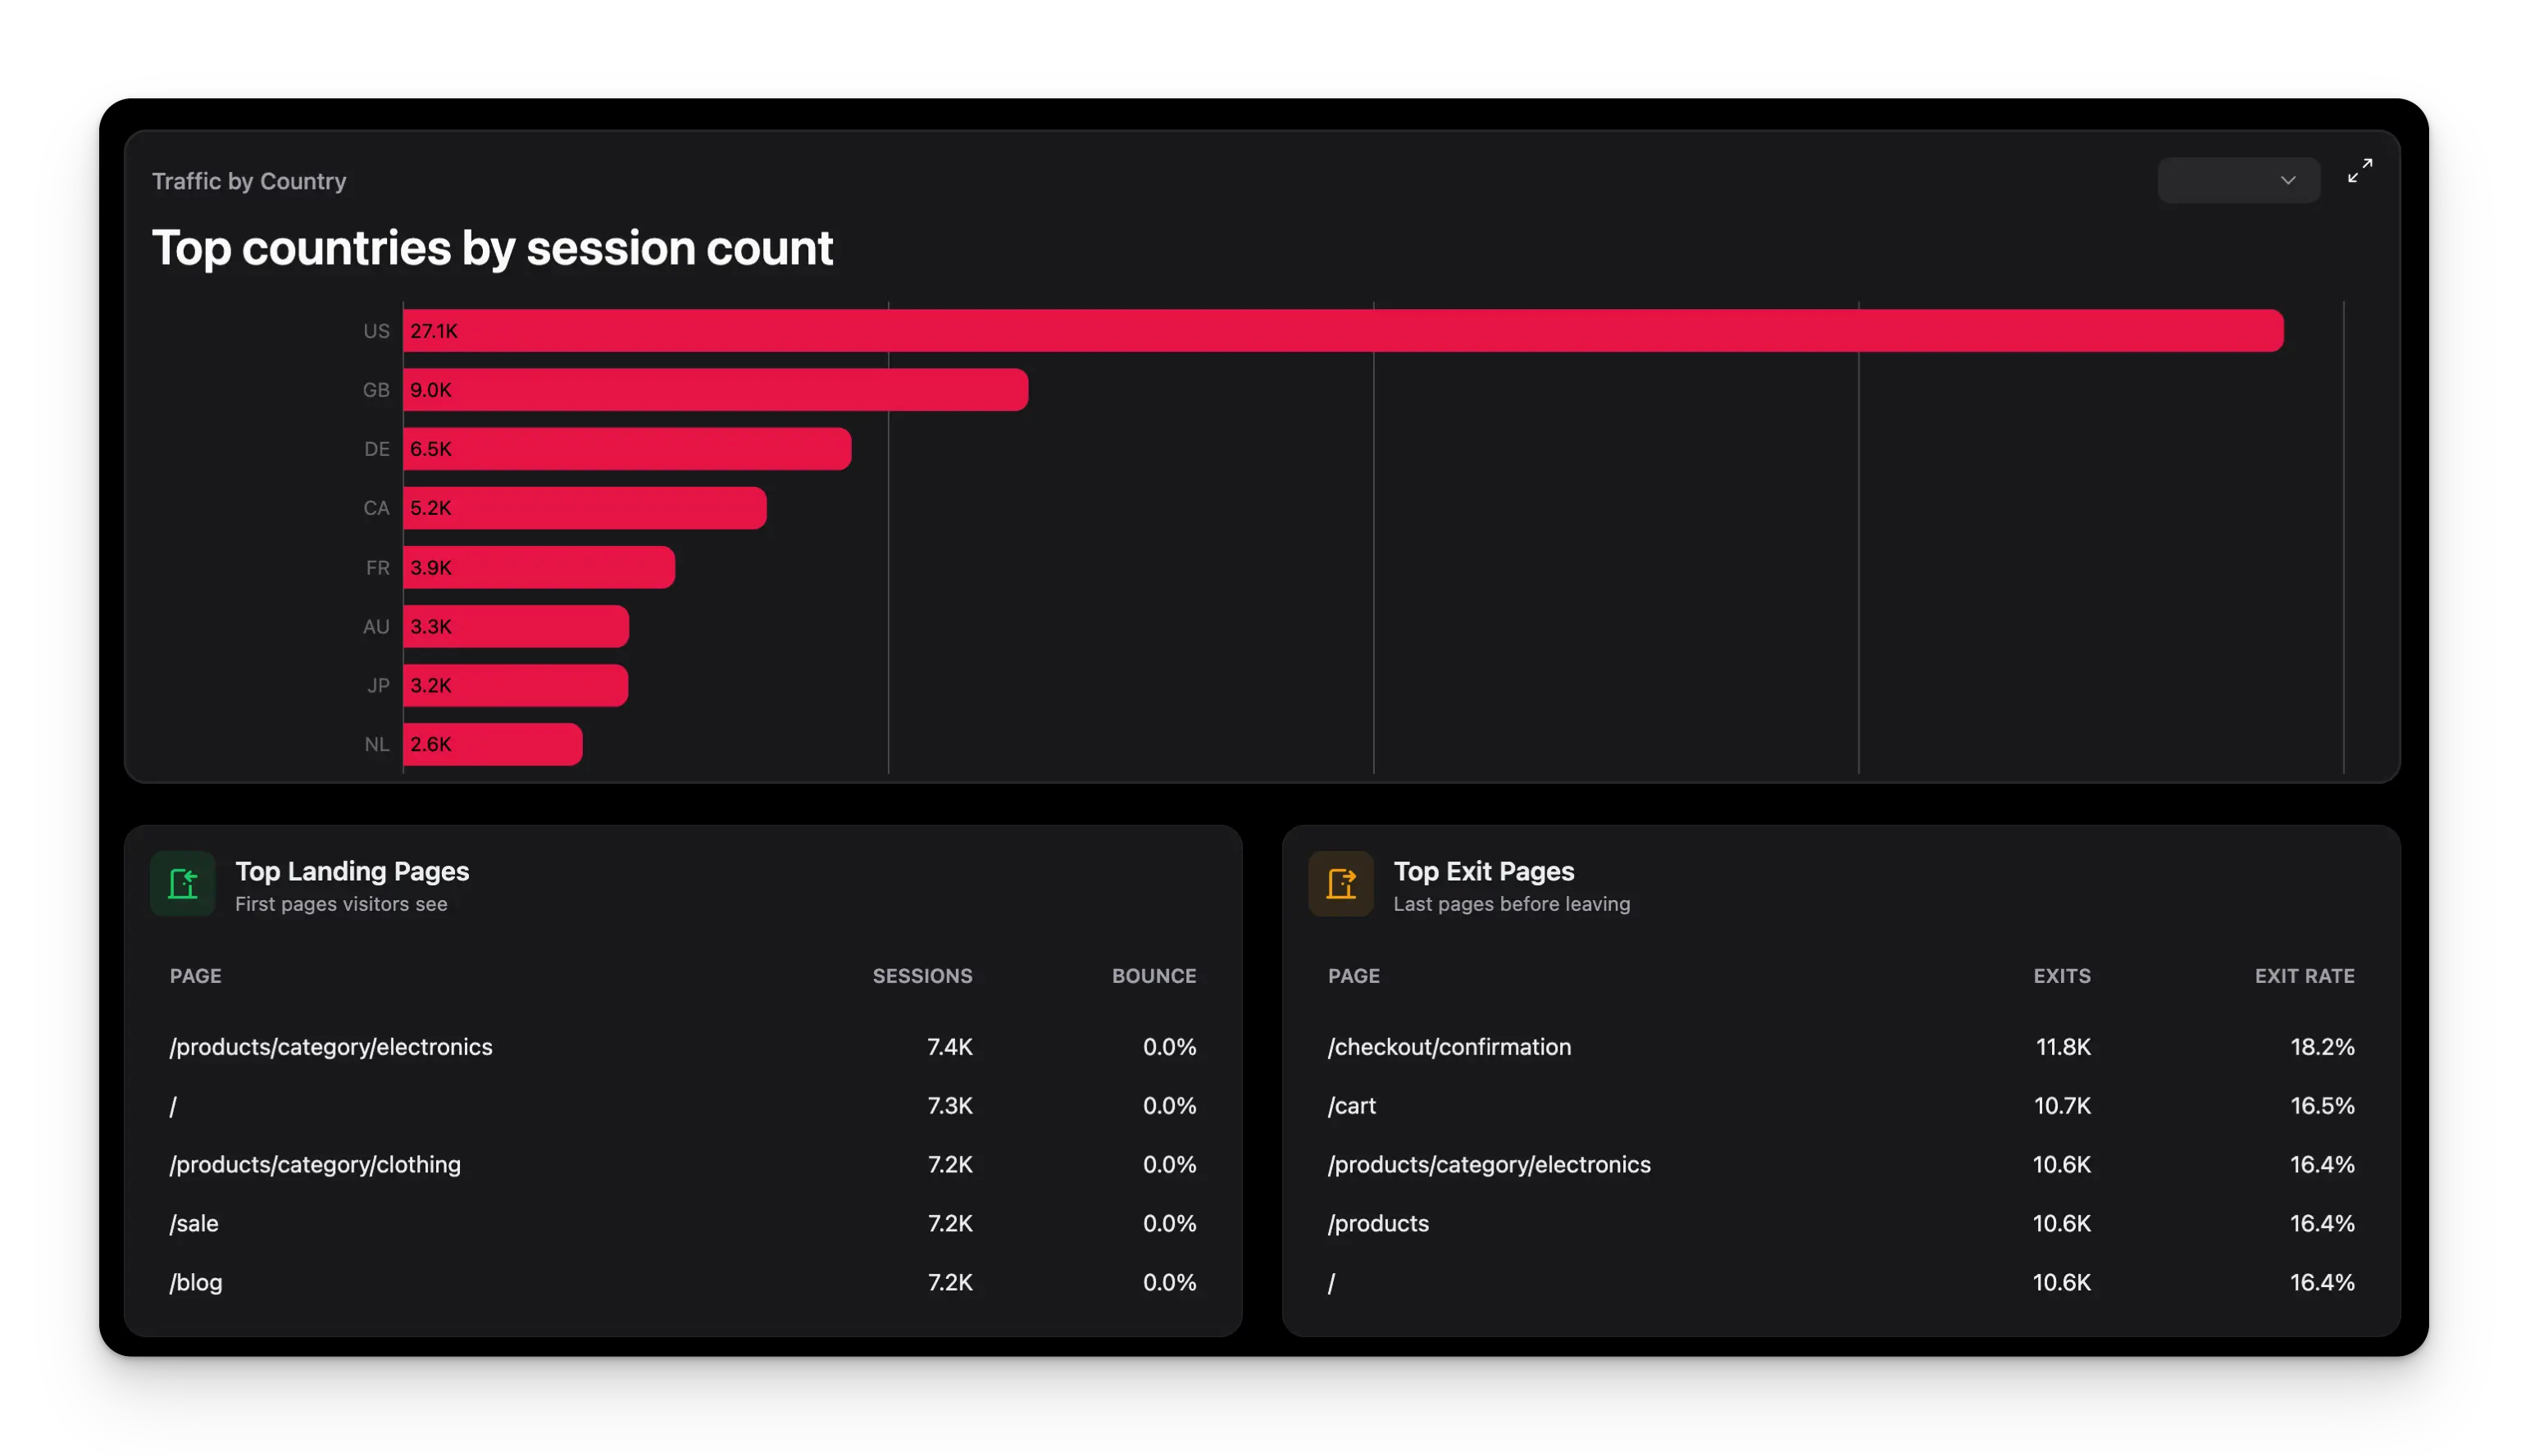 Two tables show how individual pages perform:
* **Top landing pages**: the pages visitors arrive on most, with bounce rate and average session duration per page. High-traffic pages with high bounce rates are your priority fixes.
* **Top exit pages**: the pages visitors leave from most. If checkout is a top exit page, something in the checkout flow is pushing people away.
Landing page and exit page tables depend on page-level tracking data from your platform or GA4. If your integration does not provide this data, these tables will show as not available.
## Benchmarks
Compare your numbers against these ranges to see where you stand.
| Metric | Concerning | Average | Good |
| --------------------- | ---------- | ------- | ------ |
| **Bounce rate** | >55% | 40–55% | \<40% |
| **Session duration** | \<1 min | 1–3 min | 3+ min |
| **Pages per session** | \<2 | 2–4 | 4+ |
## Act on the data
Match your next move to what the numbers show.
Audit your top landing pages in the table below. Check that page titles and meta descriptions match the actual content, poor meta copy is the most common cause of mismatched expectations. In WISEPIM, use [SEO analytics](/en/analytics/seo) to see which product pages have missing or thin meta titles, then bulk-fix them via [enriching products](/en/essentials/enriching-products). Outcome: better-matched visitors mean lower bounce and higher time-on-page.
Mobile sessions with low pages-per-session or short duration usually point to slow page loads or a broken mobile checkout. Prioritise the product pages your mobile visitors land on most (check the Top Landing Pages table), and ensure their images are optimised and descriptions are not truncated on small screens. Outcome: fixing the top three mobile landing pages typically moves overall bounce rate by 2–5 points.
That traffic is not well targeted. Compare the source's conversion rate with your organic baseline. If paid or social traffic converts at under 0.5%, the audience targeting or the landing page is the problem. Use [Marketing Attribution](/en/analytics/marketing-attribution) to see whether the issue is consistent across campaigns from that source, or isolated to one. Outcome: cutting or refocusing under-converting spend shifts budget to sources that already work.
Visitors are not finding enough value to stay. The fastest fix is richer product content on your most-visited pages. Go to [Data Quality](/en/analytics/data-quality) and filter by the categories that get the most traffic to find where descriptions and images are thin, then [enrich them](/en/essentials/enriching-products). Outcome: stores that fill content gaps on their top-traffic pages typically see session duration increase within two to four weeks.
High concentration creates risk and opportunity in equal measure. If that segment converts well, invest more there. If it underperforms, check whether the experience is localised, translated content, local currency, and local payment methods. Use [Customer Insights](/en/analytics/customer-insights) to see whether buyers from that country have comparable LTV to others. Outcome: acting on geographic concentration either captures a larger share of a proven market or surfaces a gap worth fixing.
Low return rates mean your retention is weak. Check whether you have post-purchase email flows set up, and look at [Customer Insights](/en/analytics/customer-insights) to understand repeat purchase rates. Returning visitors convert at 2–3× the rate of new ones, improving retention is usually more cost-effective than buying more new traffic. Outcome: even a 5-point shift in returning visitor share meaningfully improves blended conversion rate.
## Related
See how traffic turns into actual purchases through your conversion funnel.
Understand how visitors find products once they are on your site.
Track which marketing efforts drive the most valuable traffic.
Two tables show how individual pages perform:
* **Top landing pages**: the pages visitors arrive on most, with bounce rate and average session duration per page. High-traffic pages with high bounce rates are your priority fixes.
* **Top exit pages**: the pages visitors leave from most. If checkout is a top exit page, something in the checkout flow is pushing people away.
Landing page and exit page tables depend on page-level tracking data from your platform or GA4. If your integration does not provide this data, these tables will show as not available.
## Benchmarks
Compare your numbers against these ranges to see where you stand.
| Metric | Concerning | Average | Good |
| --------------------- | ---------- | ------- | ------ |
| **Bounce rate** | >55% | 40–55% | \<40% |
| **Session duration** | \<1 min | 1–3 min | 3+ min |
| **Pages per session** | \<2 | 2–4 | 4+ |
## Act on the data
Match your next move to what the numbers show.
Audit your top landing pages in the table below. Check that page titles and meta descriptions match the actual content, poor meta copy is the most common cause of mismatched expectations. In WISEPIM, use [SEO analytics](/en/analytics/seo) to see which product pages have missing or thin meta titles, then bulk-fix them via [enriching products](/en/essentials/enriching-products). Outcome: better-matched visitors mean lower bounce and higher time-on-page.
Mobile sessions with low pages-per-session or short duration usually point to slow page loads or a broken mobile checkout. Prioritise the product pages your mobile visitors land on most (check the Top Landing Pages table), and ensure their images are optimised and descriptions are not truncated on small screens. Outcome: fixing the top three mobile landing pages typically moves overall bounce rate by 2–5 points.
That traffic is not well targeted. Compare the source's conversion rate with your organic baseline. If paid or social traffic converts at under 0.5%, the audience targeting or the landing page is the problem. Use [Marketing Attribution](/en/analytics/marketing-attribution) to see whether the issue is consistent across campaigns from that source, or isolated to one. Outcome: cutting or refocusing under-converting spend shifts budget to sources that already work.
Visitors are not finding enough value to stay. The fastest fix is richer product content on your most-visited pages. Go to [Data Quality](/en/analytics/data-quality) and filter by the categories that get the most traffic to find where descriptions and images are thin, then [enrich them](/en/essentials/enriching-products). Outcome: stores that fill content gaps on their top-traffic pages typically see session duration increase within two to four weeks.
High concentration creates risk and opportunity in equal measure. If that segment converts well, invest more there. If it underperforms, check whether the experience is localised, translated content, local currency, and local payment methods. Use [Customer Insights](/en/analytics/customer-insights) to see whether buyers from that country have comparable LTV to others. Outcome: acting on geographic concentration either captures a larger share of a proven market or surfaces a gap worth fixing.
Low return rates mean your retention is weak. Check whether you have post-purchase email flows set up, and look at [Customer Insights](/en/analytics/customer-insights) to understand repeat purchase rates. Returning visitors convert at 2–3× the rate of new ones, improving retention is usually more cost-effective than buying more new traffic. Outcome: even a 5-point shift in returning visitor share meaningfully improves blended conversion rate.
## Related
See how traffic turns into actual purchases through your conversion funnel.
Understand how visitors find products once they are on your site.
Track which marketing efforts drive the most valuable traffic.