> ## Documentation Index
> Fetch the complete documentation index at: https://docs.wisepim.com/llms.txt
> Use this file to discover all available pages before exploring further.
# Time Patterns
> See when your customers buy, broken down by hour, day, and month. Time campaigns, staffing, and promotions to land when demand is highest.
Time Patterns shows you when customers buy. Acting on it lets you land campaigns exactly when demand peaks, run expensive AI enrichment jobs when traffic is quietest, and get ahead of key shopping events before competitors do.
Time patterns come from your order timestamps. The more order history you sync, the more reliable the patterns. Aim for at least 90 days of data before you act on them.
## Find your peak times
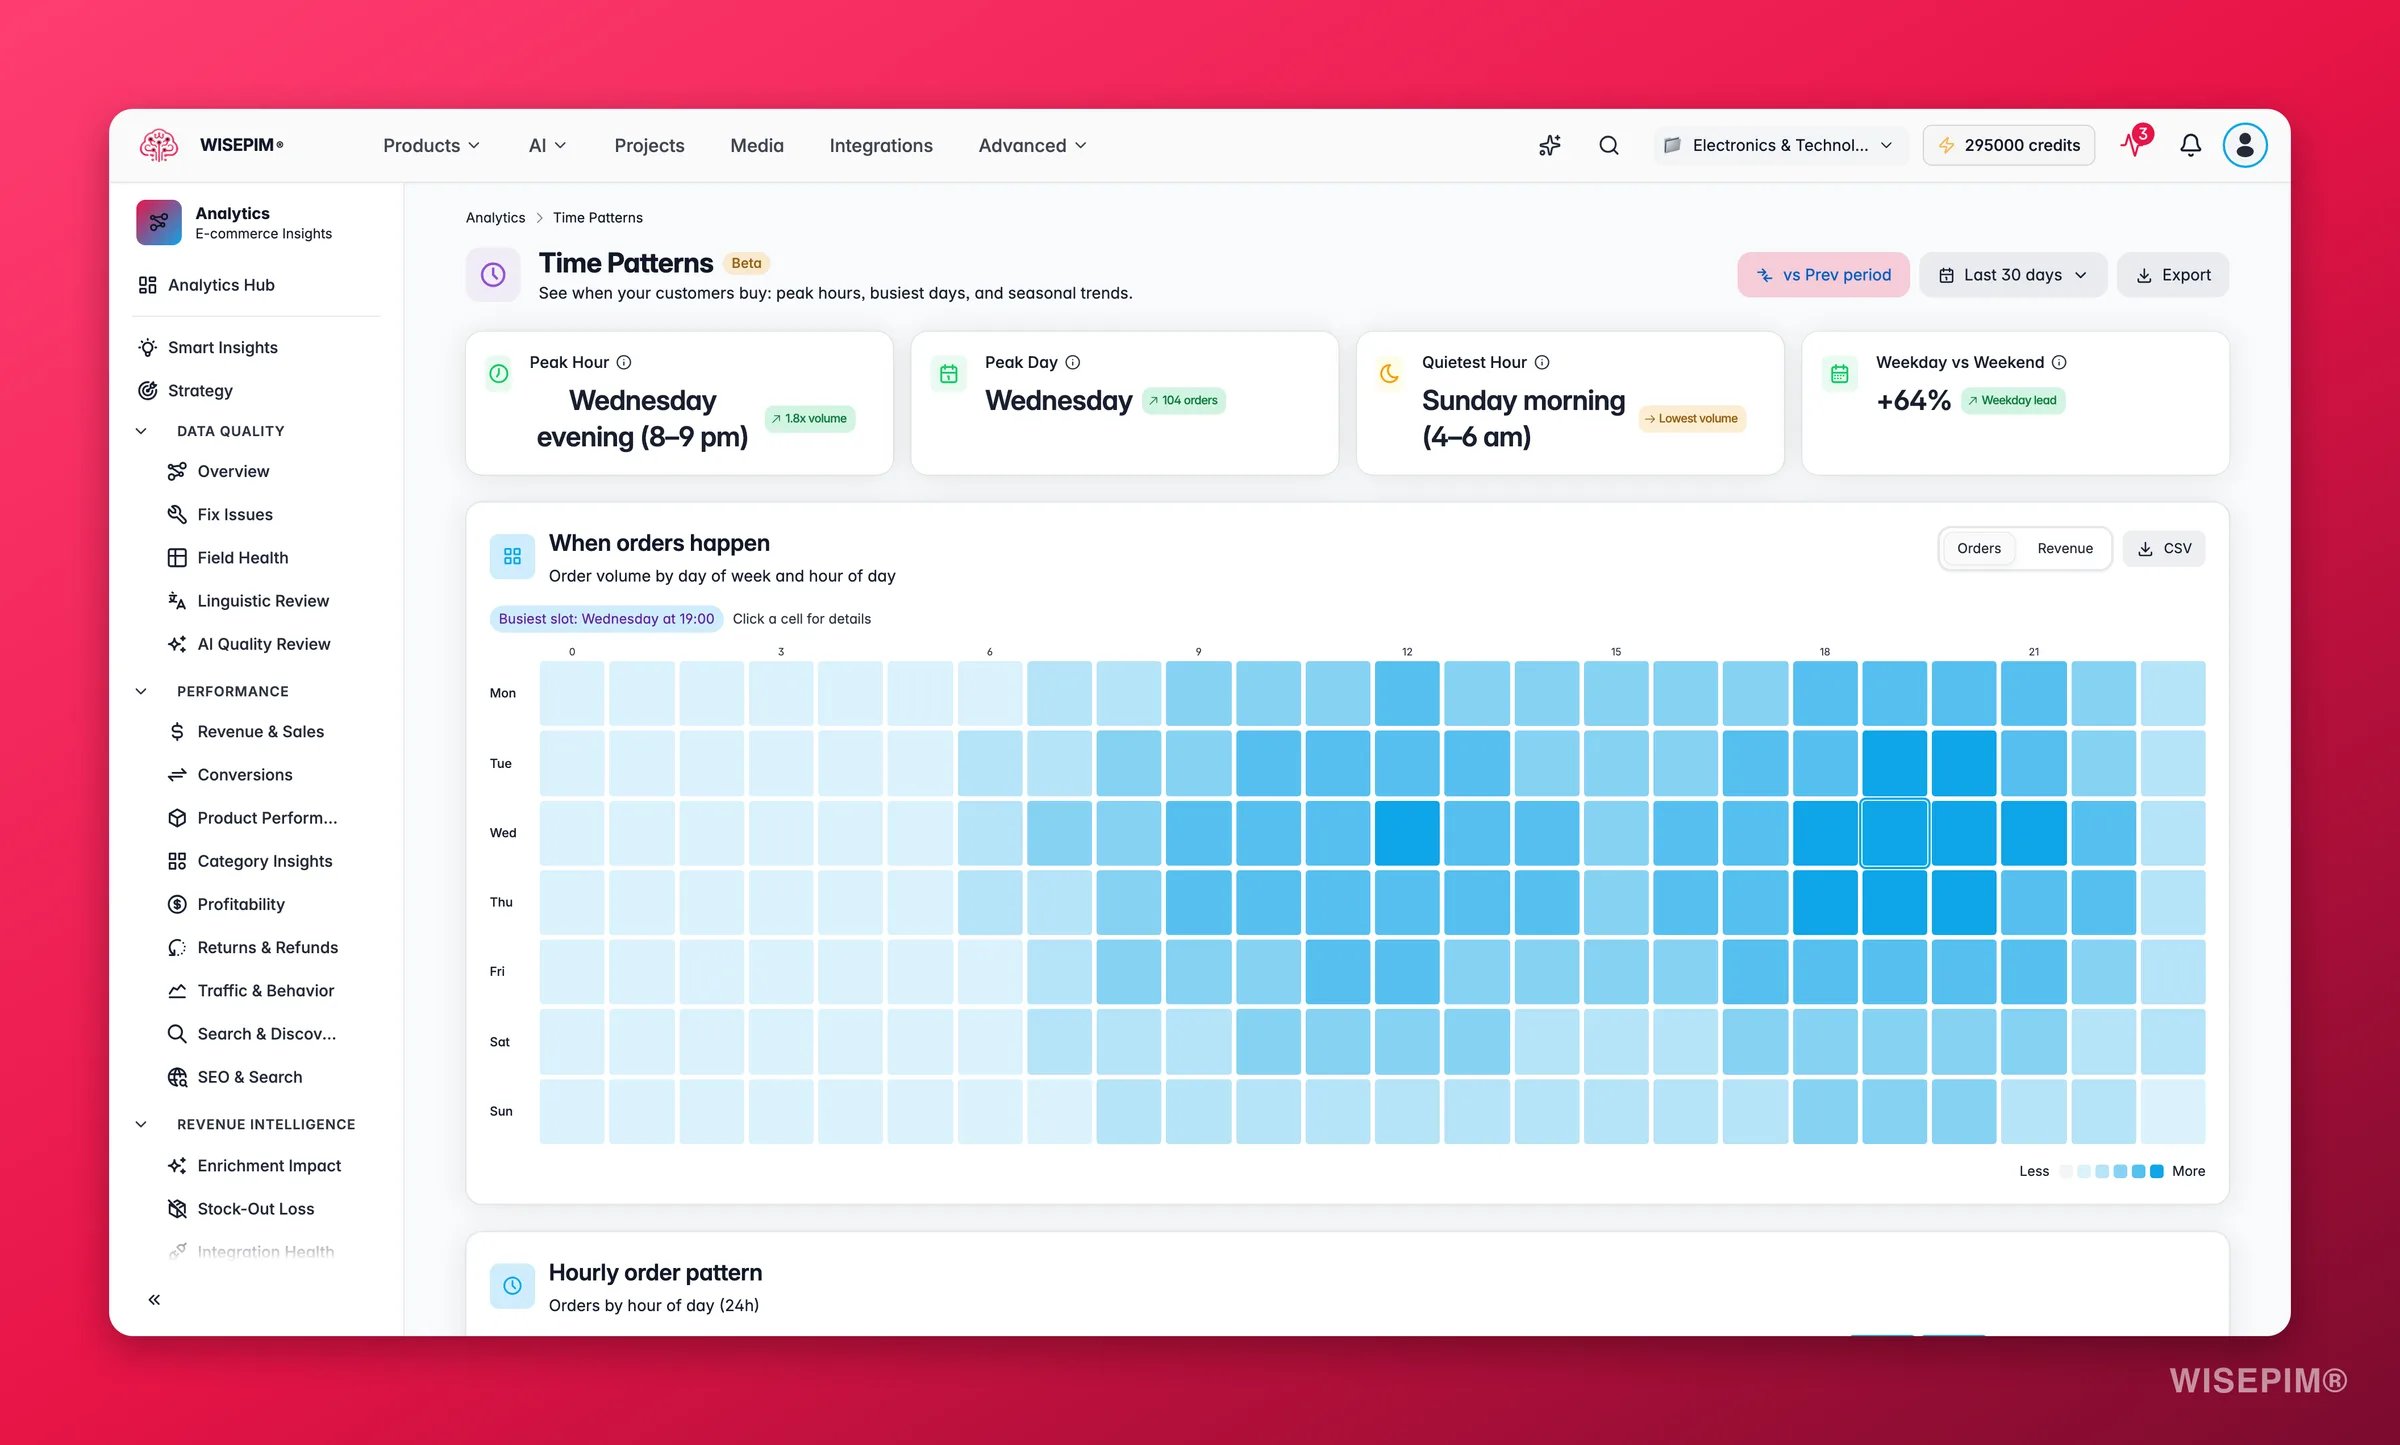
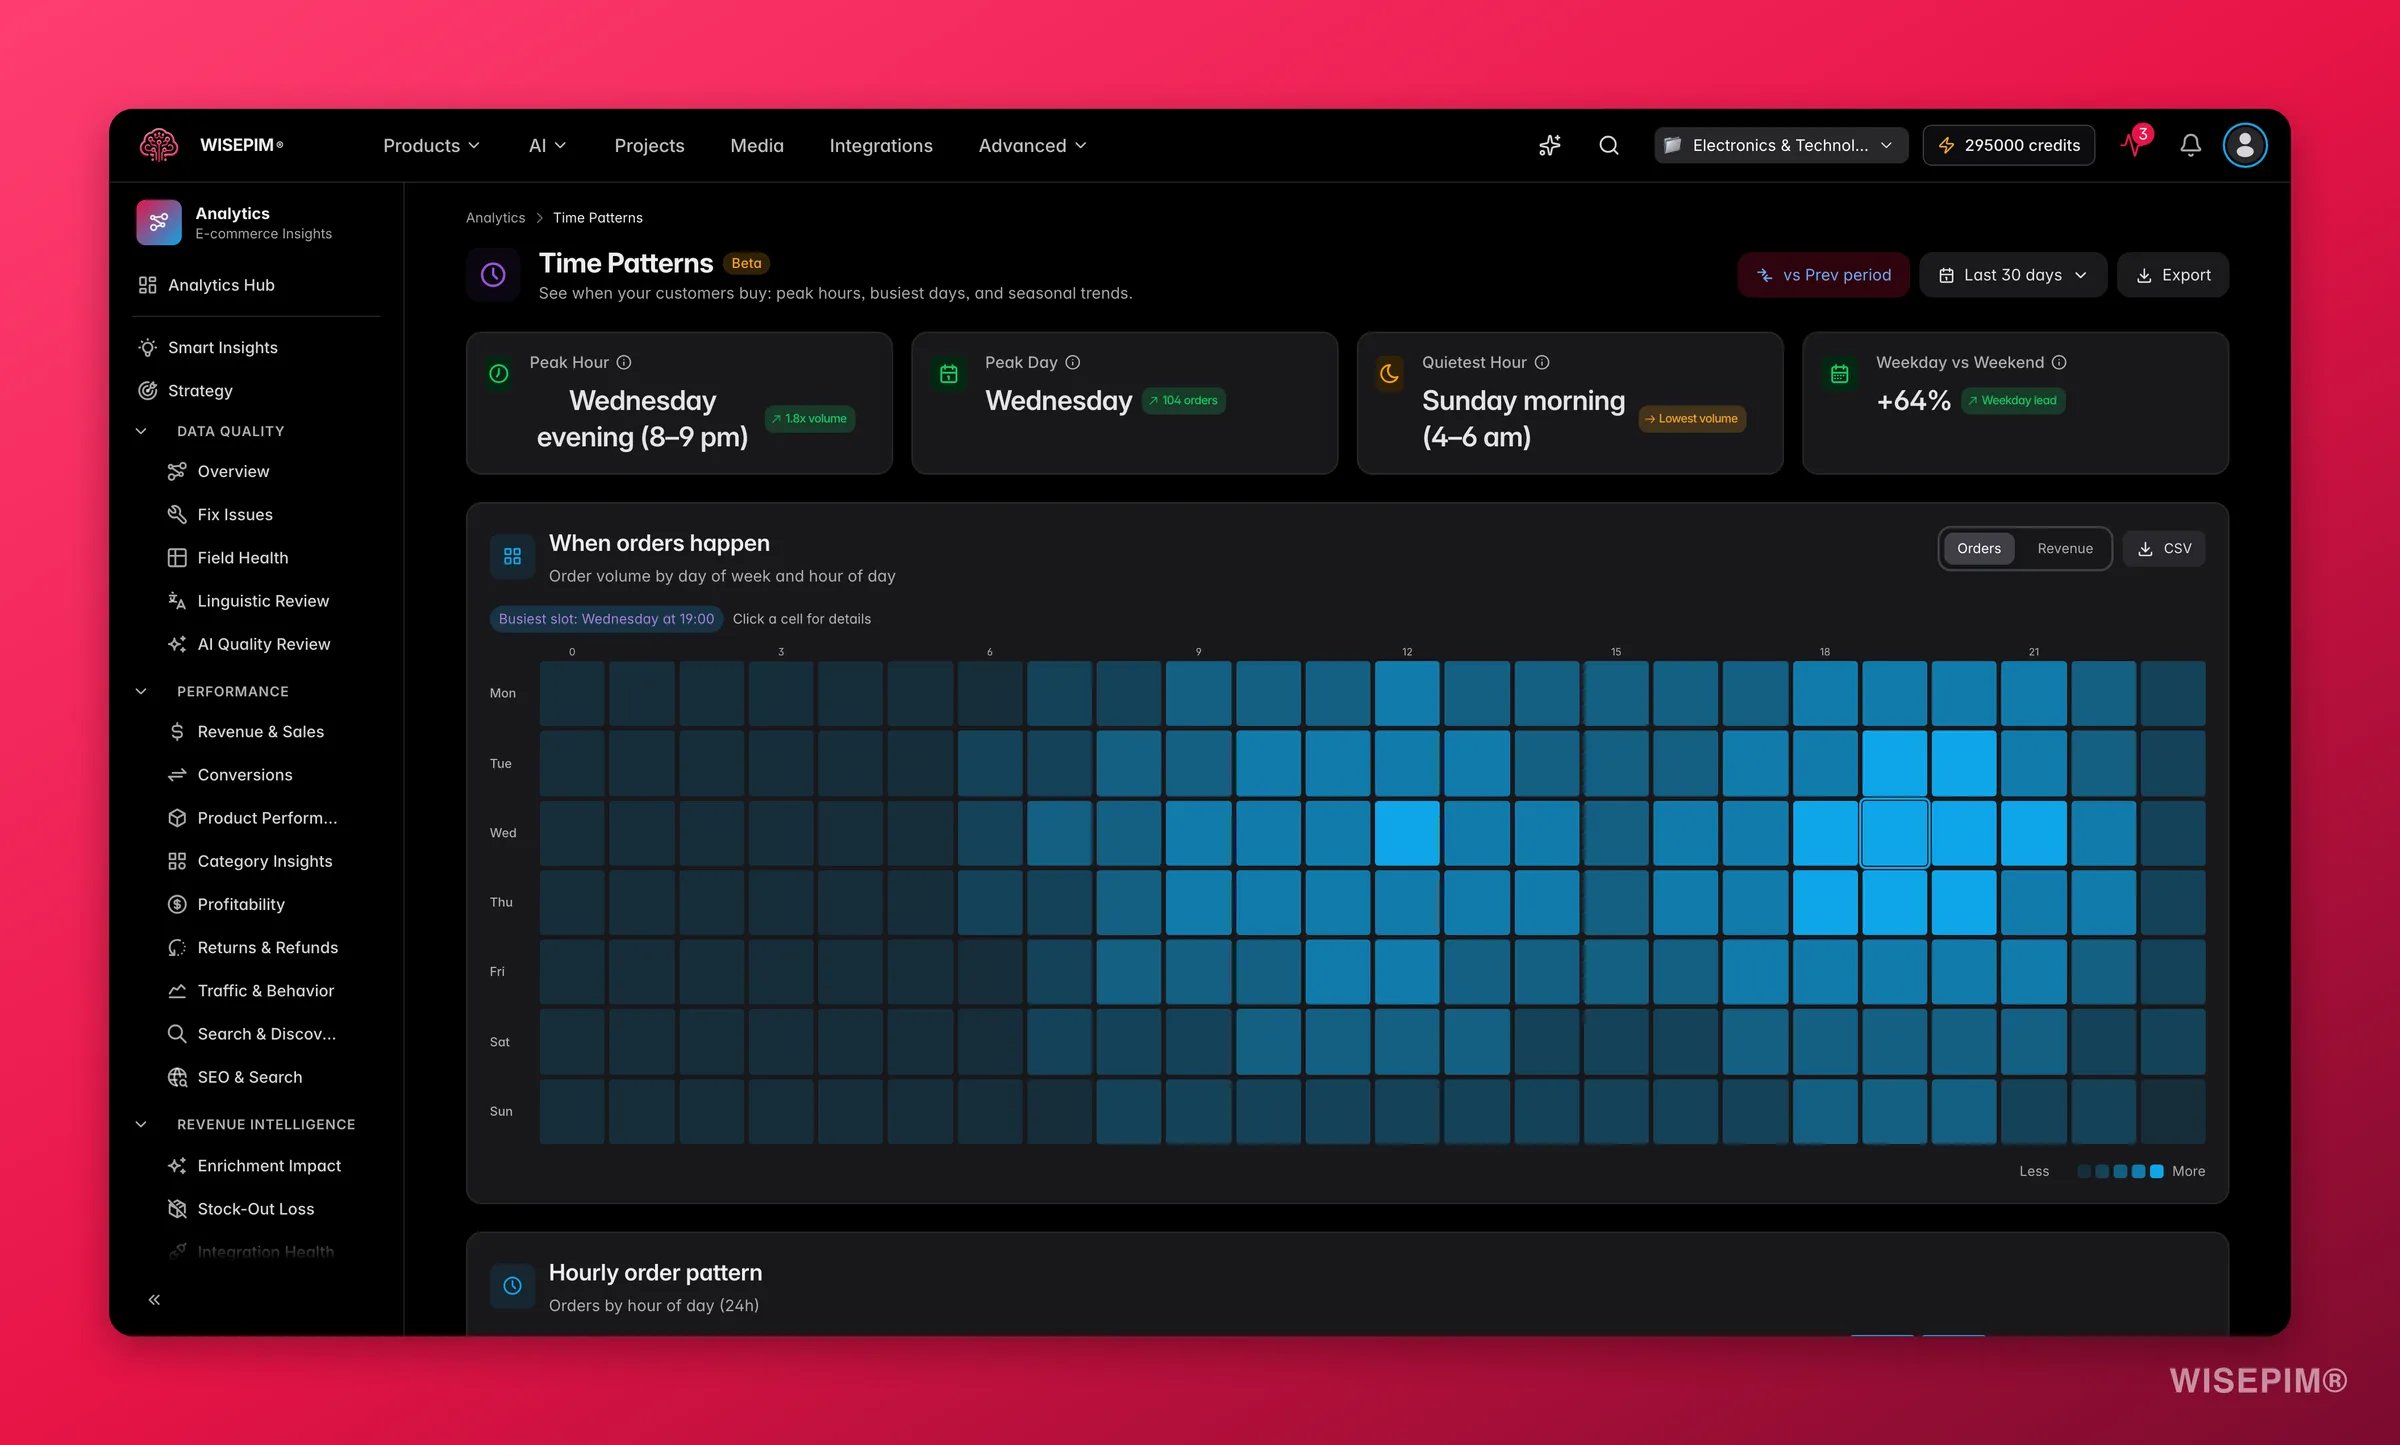 Four headline metrics orient you immediately:
| Metric | What it tells you |
| ---------------------- | --------------------------------------------------------------------------------------------------------------------------------------------------------------------------- |
| **Peak hour** | The busiest hour of day, shown as a time range (e.g. "8–10 PM"). The KPI also shows how many times busier this window is than your average hour. |
| **Peak day** | The day of the week with the highest order volume, with the order count at its peak. |
| **Quietest hour** | Your calmest window, the best time to schedule heavy AI or import jobs without competing with live traffic. |
| **Weekday vs weekend** | The percentage difference between average weekday and weekend order volume. A large positive number means weekdays drive your business; a large negative means weekends do. |
Schedule your highest-impact activities around your peaks: email campaigns, social posts, flash sales, and support staffing. Schedule heavy system jobs (bulk enrichment, feed exports) in your quietest window.
## Read the charts
The report offers several views, each answering a different timing question.
### Day × hour heatmap
The primary visualization is a 7 × 24 heatmap, days of the week on rows, hours of the day on columns. Each cell's intensity shows order volume (or revenue, switchable via the toggle). Darker cells are busier.
**How to read it:** look for a consistent hot band rather than isolated spikes. A store with a consistent evening peak from 7–10 PM on weekdays has a very different content and campaign schedule than one peaking Saturday midday. Click any cell to see a drill-down: orders, revenue, average order value, and the top-selling products in that specific slot.
| View | What it shows | Use it to |
| ------------------------ | ------------------------------------------------------------------------------------------------------- | --------------------------------------------------------------------------------- |
| **Heatmap** (day × hour) | Order volume or revenue for every weekday × hour combination. | Pinpoint the exact windows to time campaigns, sync feeds, or run maintenance. |
| **Hourly bar chart** | How orders spread across the 24 hours of the day, with peak hours highlighted. | Spot your top-3 hours at a glance. |
| **Daily bar chart** | Order volume for each day, Monday to Sunday. | Time promotions and ad spend for your strong days. |
| **Monthly bar chart** | Revenue by month over the selected period. | See seasonal trends, holiday spikes, and long-term growth or decline. |
| **Daypart cards** | Morning (6–12), evening (18–24), and peak revenue hour, each showing volume and its share of the total. | Quickly classify whether your store is a morning, evening, or balanced operation. |
The heatmap requires your platform to send individual order timestamps. When only daily totals are available, WISEPIM estimates the grid from marginal hour and day distributions and labels it "estimated."
## Plan for shopping events
Beyond your daily and weekly rhythms, Time Patterns looks ahead to the **shopping events** that matter for your store, like Black Friday, Cyber Monday, and the holiday season, adapted to your locale and industry. This is where timing turns into a concrete to-do list.
For each upcoming event the report shows:
| Signal | What it tells you |
| -------------------------- | ----------------------------------------------------------------------------------- |
| **Days until** | How much runway you have before the event. |
| **Last year's order lift** | The jump in orders the event drove previously, so you can size the opportunity. |
| **Readiness window** | The pre-event window (the days before) to get categories, content, and stock ready. |
It also turns timing into **operational recommendations** you can act on in one click:
* **Prep before a peak event**: when a high-impact event is approaching, jump straight to enriching the relevant categories.
* **Sync before the rush**: schedule feeds to finish before your peak window, with a link to [Automations](/en/automations/overview).
* **Bulk-enrich in quiet hours**: run heavy AI jobs during your calmest window so they never compete with live traffic.
* **Balance weekday vs. weekend**: when one is much busier, shift maintenance and content work to the lighter side.
Start event prep early. The report flags events up to roughly six weeks out, which is the right moment to enrich categories, fix stock, and schedule campaigns before demand arrives.
## Act on what you find
The report surfaces four operational recommendations automatically, generated from your specific peak, quiet window, weekday/weekend skew, and upcoming events. Below is how to act on the most common patterns.
Schedule email campaigns and social posts to land 30–60 minutes before your peak window. Also schedule feed exports and price syncs to complete before the peak so your catalog is accurate when traffic is highest. Use [Automations](/en/automations/overview) to set a recurring feed schedule that finishes before your peak day. **Outcome:** campaigns hit customers at their most purchase-ready moment; feed errors don't surface during your busiest window.
Run heavy AI enrichment jobs, bulk description generation, image processing, imports, in your quietest hours. This avoids competing with live traffic for server resources. Go to [Products](/en/essentials/managing-products) and queue a bulk enrich job timed to your calm window. **Outcome:** enrichment runs faster and has no impact on shopper-facing performance.
When weekdays run significantly heavier, use weekends for maintenance, content updates, and re-enrichment without worrying about disruption. When weekends are busier, ensure content and feed syncs are ready before Friday, don't schedule major updates during your peak. **Outcome:** maintenance happens at the time of least customer impact.
The Event Readiness section below the charts flags upcoming key dates (Black Friday, Cyber Monday, seasonal peaks) with last year's order lift and a readiness window. When an event is within 45 days and drove strong lift previously, click the prep link to jump directly to enriching that event's top categories. **Outcome:** you enter the peak window with complete, compelling product content rather than scrambling during it.
You have no extreme peaks, so demand is steady. Focus on consistent catalog improvement, [Data Quality](/en/analytics/data-quality) and enrichment, rather than timing-specific tuning. The lack of a peak also means your feed and sync schedules have more flexibility.
## Related
See how time-based patterns turn into revenue trends and order volumes.
Align your marketing spend with the times customers are most likely to buy.
Compare traffic patterns with buying patterns to find timing gaps.
Four headline metrics orient you immediately:
| Metric | What it tells you |
| ---------------------- | --------------------------------------------------------------------------------------------------------------------------------------------------------------------------- |
| **Peak hour** | The busiest hour of day, shown as a time range (e.g. "8–10 PM"). The KPI also shows how many times busier this window is than your average hour. |
| **Peak day** | The day of the week with the highest order volume, with the order count at its peak. |
| **Quietest hour** | Your calmest window, the best time to schedule heavy AI or import jobs without competing with live traffic. |
| **Weekday vs weekend** | The percentage difference between average weekday and weekend order volume. A large positive number means weekdays drive your business; a large negative means weekends do. |
Schedule your highest-impact activities around your peaks: email campaigns, social posts, flash sales, and support staffing. Schedule heavy system jobs (bulk enrichment, feed exports) in your quietest window.
## Read the charts
The report offers several views, each answering a different timing question.
### Day × hour heatmap
The primary visualization is a 7 × 24 heatmap, days of the week on rows, hours of the day on columns. Each cell's intensity shows order volume (or revenue, switchable via the toggle). Darker cells are busier.
**How to read it:** look for a consistent hot band rather than isolated spikes. A store with a consistent evening peak from 7–10 PM on weekdays has a very different content and campaign schedule than one peaking Saturday midday. Click any cell to see a drill-down: orders, revenue, average order value, and the top-selling products in that specific slot.
| View | What it shows | Use it to |
| ------------------------ | ------------------------------------------------------------------------------------------------------- | --------------------------------------------------------------------------------- |
| **Heatmap** (day × hour) | Order volume or revenue for every weekday × hour combination. | Pinpoint the exact windows to time campaigns, sync feeds, or run maintenance. |
| **Hourly bar chart** | How orders spread across the 24 hours of the day, with peak hours highlighted. | Spot your top-3 hours at a glance. |
| **Daily bar chart** | Order volume for each day, Monday to Sunday. | Time promotions and ad spend for your strong days. |
| **Monthly bar chart** | Revenue by month over the selected period. | See seasonal trends, holiday spikes, and long-term growth or decline. |
| **Daypart cards** | Morning (6–12), evening (18–24), and peak revenue hour, each showing volume and its share of the total. | Quickly classify whether your store is a morning, evening, or balanced operation. |
The heatmap requires your platform to send individual order timestamps. When only daily totals are available, WISEPIM estimates the grid from marginal hour and day distributions and labels it "estimated."
## Plan for shopping events
Beyond your daily and weekly rhythms, Time Patterns looks ahead to the **shopping events** that matter for your store, like Black Friday, Cyber Monday, and the holiday season, adapted to your locale and industry. This is where timing turns into a concrete to-do list.
For each upcoming event the report shows:
| Signal | What it tells you |
| -------------------------- | ----------------------------------------------------------------------------------- |
| **Days until** | How much runway you have before the event. |
| **Last year's order lift** | The jump in orders the event drove previously, so you can size the opportunity. |
| **Readiness window** | The pre-event window (the days before) to get categories, content, and stock ready. |
It also turns timing into **operational recommendations** you can act on in one click:
* **Prep before a peak event**: when a high-impact event is approaching, jump straight to enriching the relevant categories.
* **Sync before the rush**: schedule feeds to finish before your peak window, with a link to [Automations](/en/automations/overview).
* **Bulk-enrich in quiet hours**: run heavy AI jobs during your calmest window so they never compete with live traffic.
* **Balance weekday vs. weekend**: when one is much busier, shift maintenance and content work to the lighter side.
Start event prep early. The report flags events up to roughly six weeks out, which is the right moment to enrich categories, fix stock, and schedule campaigns before demand arrives.
## Act on what you find
The report surfaces four operational recommendations automatically, generated from your specific peak, quiet window, weekday/weekend skew, and upcoming events. Below is how to act on the most common patterns.
Schedule email campaigns and social posts to land 30–60 minutes before your peak window. Also schedule feed exports and price syncs to complete before the peak so your catalog is accurate when traffic is highest. Use [Automations](/en/automations/overview) to set a recurring feed schedule that finishes before your peak day. **Outcome:** campaigns hit customers at their most purchase-ready moment; feed errors don't surface during your busiest window.
Run heavy AI enrichment jobs, bulk description generation, image processing, imports, in your quietest hours. This avoids competing with live traffic for server resources. Go to [Products](/en/essentials/managing-products) and queue a bulk enrich job timed to your calm window. **Outcome:** enrichment runs faster and has no impact on shopper-facing performance.
When weekdays run significantly heavier, use weekends for maintenance, content updates, and re-enrichment without worrying about disruption. When weekends are busier, ensure content and feed syncs are ready before Friday, don't schedule major updates during your peak. **Outcome:** maintenance happens at the time of least customer impact.
The Event Readiness section below the charts flags upcoming key dates (Black Friday, Cyber Monday, seasonal peaks) with last year's order lift and a readiness window. When an event is within 45 days and drove strong lift previously, click the prep link to jump directly to enriching that event's top categories. **Outcome:** you enter the peak window with complete, compelling product content rather than scrambling during it.
You have no extreme peaks, so demand is steady. Focus on consistent catalog improvement, [Data Quality](/en/analytics/data-quality) and enrichment, rather than timing-specific tuning. The lack of a peak also means your feed and sync schedules have more flexibility.
## Related
See how time-based patterns turn into revenue trends and order volumes.
Align your marketing spend with the times customers are most likely to buy.
Compare traffic patterns with buying patterns to find timing gaps.