> ## Documentation Index
> Fetch the complete documentation index at: https://docs.wisepim.com/llms.txt
> Use this file to discover all available pages before exploring further.
# Stock-Out Loss
> Estimate the revenue you missed while products were out of stock, and get a refill priority list ranked by lost sales.
The Stock-Out Loss report estimates the revenue you missed while SKUs were unavailable. It turns out-of-stock windows into a number you can act on, and ranks which products to restock first.
**What acting on it enables:** stop losing sales to avoidable stock-outs, restock the right SKUs before a peak window, and surface the exact products and categories where availability is costing you the most.
This report needs order history (to learn each product's sales velocity) and inventory data (to know when products were out of stock). The lost-revenue figure is an estimate based on historical demand.
## Key metrics
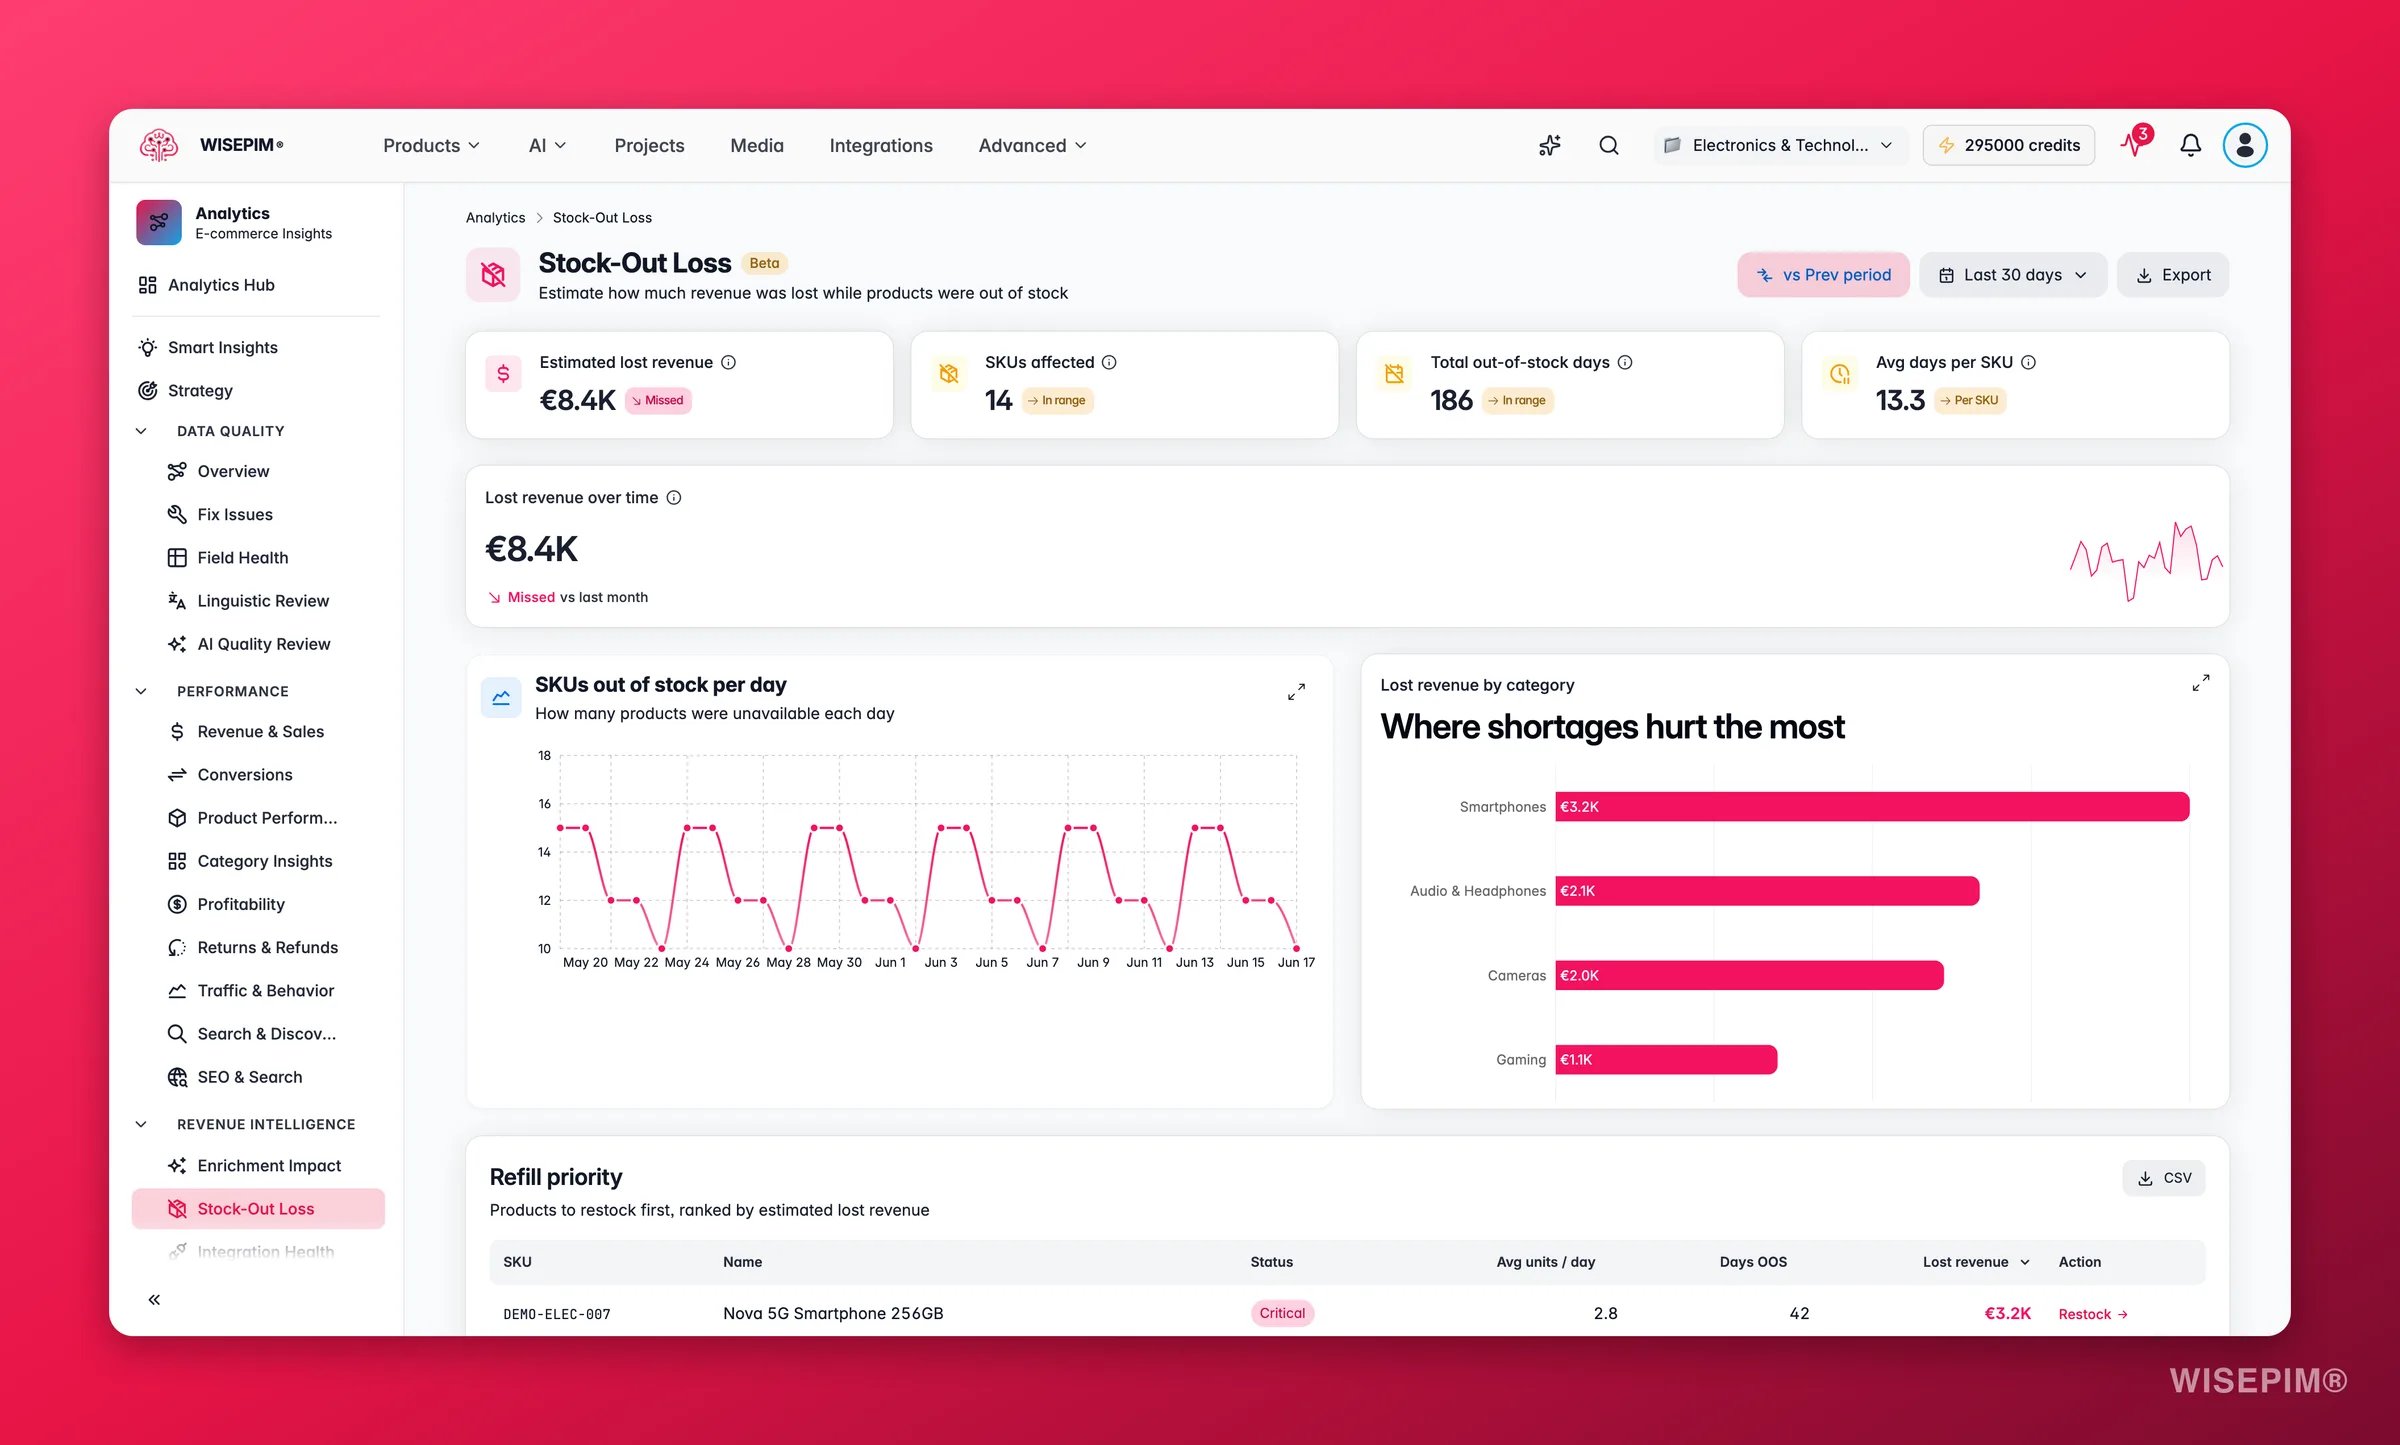
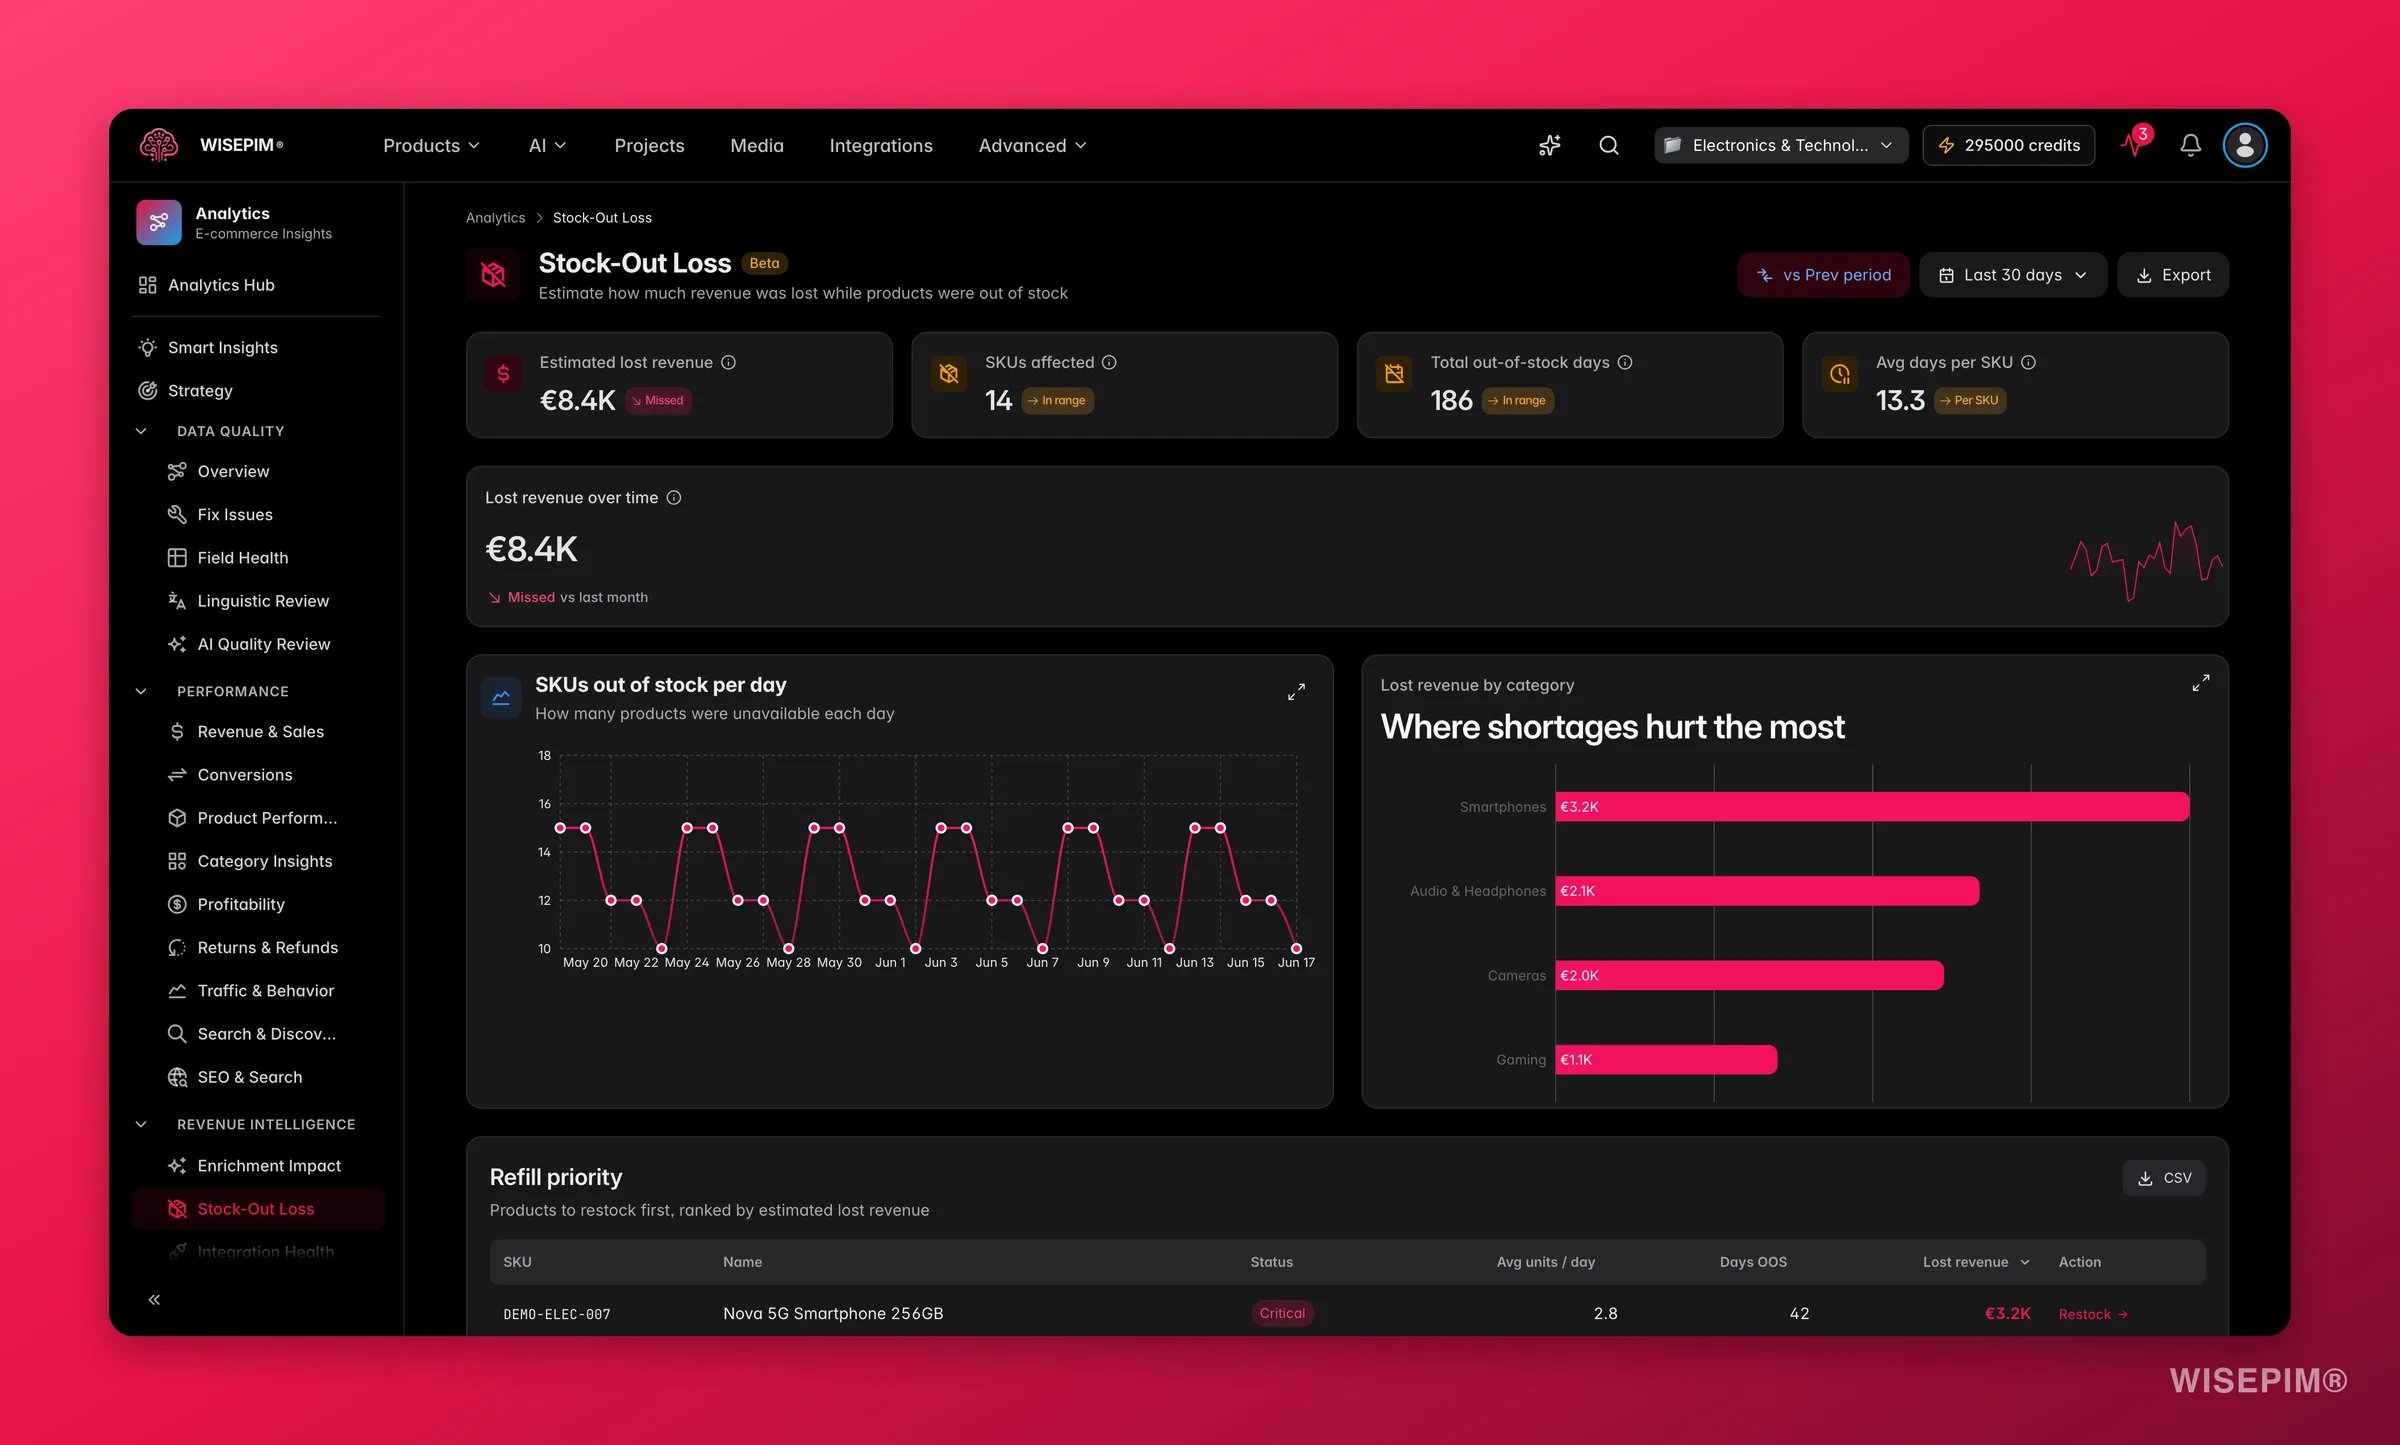 | Metric | What it tells you |
| -------------------------- | ----------------------------------------------------------------------------------------------------------- |
| **Estimated lost revenue** | Sales you likely missed while products were out of stock, based on each product's average daily sales rate. |
| **SKUs affected** | How many products ran out during the period. |
| **Out-of-stock days** | Total stock-out days across all products, a measure of overall availability pressure. |
| **Average days per SKU** | How long products typically stay unavailable once they go out of stock. |
### What good looks like
There is no universal benchmark for "acceptable" stock-outs, a fashion retailer manages them differently from a replenishable goods seller. But these directional signals apply broadly:
| Average days per SKU | Signal |
| -------------------- | ---------------------------------------------------------------- |
| Under 3 days | Good, fast restock or low demand for those SKUs |
| 3 – 7 days | Moderate, worth reviewing reorder triggers |
| 7 – 14 days | Elevated, lead times or demand forecasting likely need attention |
| 14 + days | Concerning, prolonged unavailability is actively losing sales |
The refill priority table uses built-in severity thresholds to help triage:
| Status | Criteria |
| ------------ | ------------------------------------------------------- |
| **Critical** | Estimated lost revenue ≥ €500, or 14+ days out of stock |
| **At Risk** | Estimated lost revenue ≥ €100, or 5+ days out of stock |
| **Watch** | Below those thresholds but still affected |
## Charts and tables
* **Lost revenue over time**: when stock-outs cost you the most, so you can tie losses to demand spikes or seasonal peaks.
* **SKUs out of stock per day**: (shown when available) how many products were simultaneously unavailable each day. A rising count signals a systemic restock problem rather than isolated SKU issues.
* **Lost revenue by category**: the categories where availability hurts you most. Use this to prioritize which category to fix first.
* **Refill priority**: a ranked table of products to restock, with their severity status (**Critical**, **At Risk**, **Watch**), average units sold per day, days out of stock, and estimated lost revenue. Export as CSV to share with a buyer or warehouse team.
Pair this with [Time Patterns](/en/analytics/time-patterns). Restocking your top SKUs before a known peak window protects the revenue you would otherwise lose, the combination of velocity data and timing is more powerful than either alone.
## Reading the results
* **A few SKUs account for most of the lost revenue**: this is the common pattern. Your top 5–10 out-of-stock products often represent over half of total estimated loss. Focus the refill priority table on Critical items first.
* **Lost revenue spikes align with a specific date**: this usually corresponds to a demand event (sale, external traffic spike, seasonal peak) that exhausted stock faster than expected. Use [Time Patterns](/en/analytics/time-patterns) to anticipate these windows next time.
* **Many SKUs affected but low total lost revenue**: the out-of-stock products are slow movers. Low urgency, but worth reviewing reorder minimums so they stay available passively.
* **A whole category in red**: likely a supplier or lead-time issue affecting the category as a whole, rather than individual SKU mis-forecasting.
## Act on what you find
Open each Critical-status product from the refill priority table and update stock levels. Use [Bulk: Update Stock](/en/essentials/bulk-editing/update-stock) to push updated quantities across channels at once. For recurring top sellers, set up a low-stock automation alert so you are notified before they run out, see [Automations](/en/automations/overview). **Outcome:** restore availability on your highest-revenue SKUs and stop the daily revenue loss they represent.
Filter the refill priority table by category (or use the lost revenue by category chart) and review reorder triggers for that group. A systemic gap often means the reorder point is set too low or lead times have changed. Adjust quantities in bulk with [Bulk: Update Stock](/en/essentials/bulk-editing/update-stock). **Outcome:** reduce category-level availability failures rather than chasing individual SKUs one at a time.
Cross-reference with [Time Patterns](/en/analytics/time-patterns) to confirm seasonality, then build a pre-season stock buffer. You can automate a reorder trigger ahead of the peak using [Automations](/en/automations/overview). **Outcome:** eliminate predictable peak-season stock-outs before they happen.
Prolonged unavailability usually signals a supply-chain or lead-time problem rather than a forecasting one. Verify supplier lead times in your integrations and consider safety-stock buffers on your fastest-moving lines. Connect or audit your inventory feeds under [Integrations](/en/integrations/supported-platforms) to ensure stock levels are syncing in near real time. **Outcome:** reduce average downtime per SKU so that each stock-out event is shorter and less costly.
## Related
Refill bestsellers before your peak windows.
See the revenue stock-outs are eating into.
Update stock levels across many products at once.
Automate low-stock alerts and supplier syncs.
| Metric | What it tells you |
| -------------------------- | ----------------------------------------------------------------------------------------------------------- |
| **Estimated lost revenue** | Sales you likely missed while products were out of stock, based on each product's average daily sales rate. |
| **SKUs affected** | How many products ran out during the period. |
| **Out-of-stock days** | Total stock-out days across all products, a measure of overall availability pressure. |
| **Average days per SKU** | How long products typically stay unavailable once they go out of stock. |
### What good looks like
There is no universal benchmark for "acceptable" stock-outs, a fashion retailer manages them differently from a replenishable goods seller. But these directional signals apply broadly:
| Average days per SKU | Signal |
| -------------------- | ---------------------------------------------------------------- |
| Under 3 days | Good, fast restock or low demand for those SKUs |
| 3 – 7 days | Moderate, worth reviewing reorder triggers |
| 7 – 14 days | Elevated, lead times or demand forecasting likely need attention |
| 14 + days | Concerning, prolonged unavailability is actively losing sales |
The refill priority table uses built-in severity thresholds to help triage:
| Status | Criteria |
| ------------ | ------------------------------------------------------- |
| **Critical** | Estimated lost revenue ≥ €500, or 14+ days out of stock |
| **At Risk** | Estimated lost revenue ≥ €100, or 5+ days out of stock |
| **Watch** | Below those thresholds but still affected |
## Charts and tables
* **Lost revenue over time**: when stock-outs cost you the most, so you can tie losses to demand spikes or seasonal peaks.
* **SKUs out of stock per day**: (shown when available) how many products were simultaneously unavailable each day. A rising count signals a systemic restock problem rather than isolated SKU issues.
* **Lost revenue by category**: the categories where availability hurts you most. Use this to prioritize which category to fix first.
* **Refill priority**: a ranked table of products to restock, with their severity status (**Critical**, **At Risk**, **Watch**), average units sold per day, days out of stock, and estimated lost revenue. Export as CSV to share with a buyer or warehouse team.
Pair this with [Time Patterns](/en/analytics/time-patterns). Restocking your top SKUs before a known peak window protects the revenue you would otherwise lose, the combination of velocity data and timing is more powerful than either alone.
## Reading the results
* **A few SKUs account for most of the lost revenue**: this is the common pattern. Your top 5–10 out-of-stock products often represent over half of total estimated loss. Focus the refill priority table on Critical items first.
* **Lost revenue spikes align with a specific date**: this usually corresponds to a demand event (sale, external traffic spike, seasonal peak) that exhausted stock faster than expected. Use [Time Patterns](/en/analytics/time-patterns) to anticipate these windows next time.
* **Many SKUs affected but low total lost revenue**: the out-of-stock products are slow movers. Low urgency, but worth reviewing reorder minimums so they stay available passively.
* **A whole category in red**: likely a supplier or lead-time issue affecting the category as a whole, rather than individual SKU mis-forecasting.
## Act on what you find
Open each Critical-status product from the refill priority table and update stock levels. Use [Bulk: Update Stock](/en/essentials/bulk-editing/update-stock) to push updated quantities across channels at once. For recurring top sellers, set up a low-stock automation alert so you are notified before they run out, see [Automations](/en/automations/overview). **Outcome:** restore availability on your highest-revenue SKUs and stop the daily revenue loss they represent.
Filter the refill priority table by category (or use the lost revenue by category chart) and review reorder triggers for that group. A systemic gap often means the reorder point is set too low or lead times have changed. Adjust quantities in bulk with [Bulk: Update Stock](/en/essentials/bulk-editing/update-stock). **Outcome:** reduce category-level availability failures rather than chasing individual SKUs one at a time.
Cross-reference with [Time Patterns](/en/analytics/time-patterns) to confirm seasonality, then build a pre-season stock buffer. You can automate a reorder trigger ahead of the peak using [Automations](/en/automations/overview). **Outcome:** eliminate predictable peak-season stock-outs before they happen.
Prolonged unavailability usually signals a supply-chain or lead-time problem rather than a forecasting one. Verify supplier lead times in your integrations and consider safety-stock buffers on your fastest-moving lines. Connect or audit your inventory feeds under [Integrations](/en/integrations/supported-platforms) to ensure stock levels are syncing in near real time. **Outcome:** reduce average downtime per SKU so that each stock-out event is shorter and less costly.
## Related
Refill bestsellers before your peak windows.
See the revenue stock-outs are eating into.
Update stock levels across many products at once.
Automate low-stock alerts and supplier syncs.