> ## Documentation Index
> Fetch the complete documentation index at: https://docs.wisepim.com/llms.txt
> Use this file to discover all available pages before exploring further.
# Search & Discovery
> See how customers find products in your store. Track search queries, zero-result terms, and browsing patterns to close gaps and boost sales.
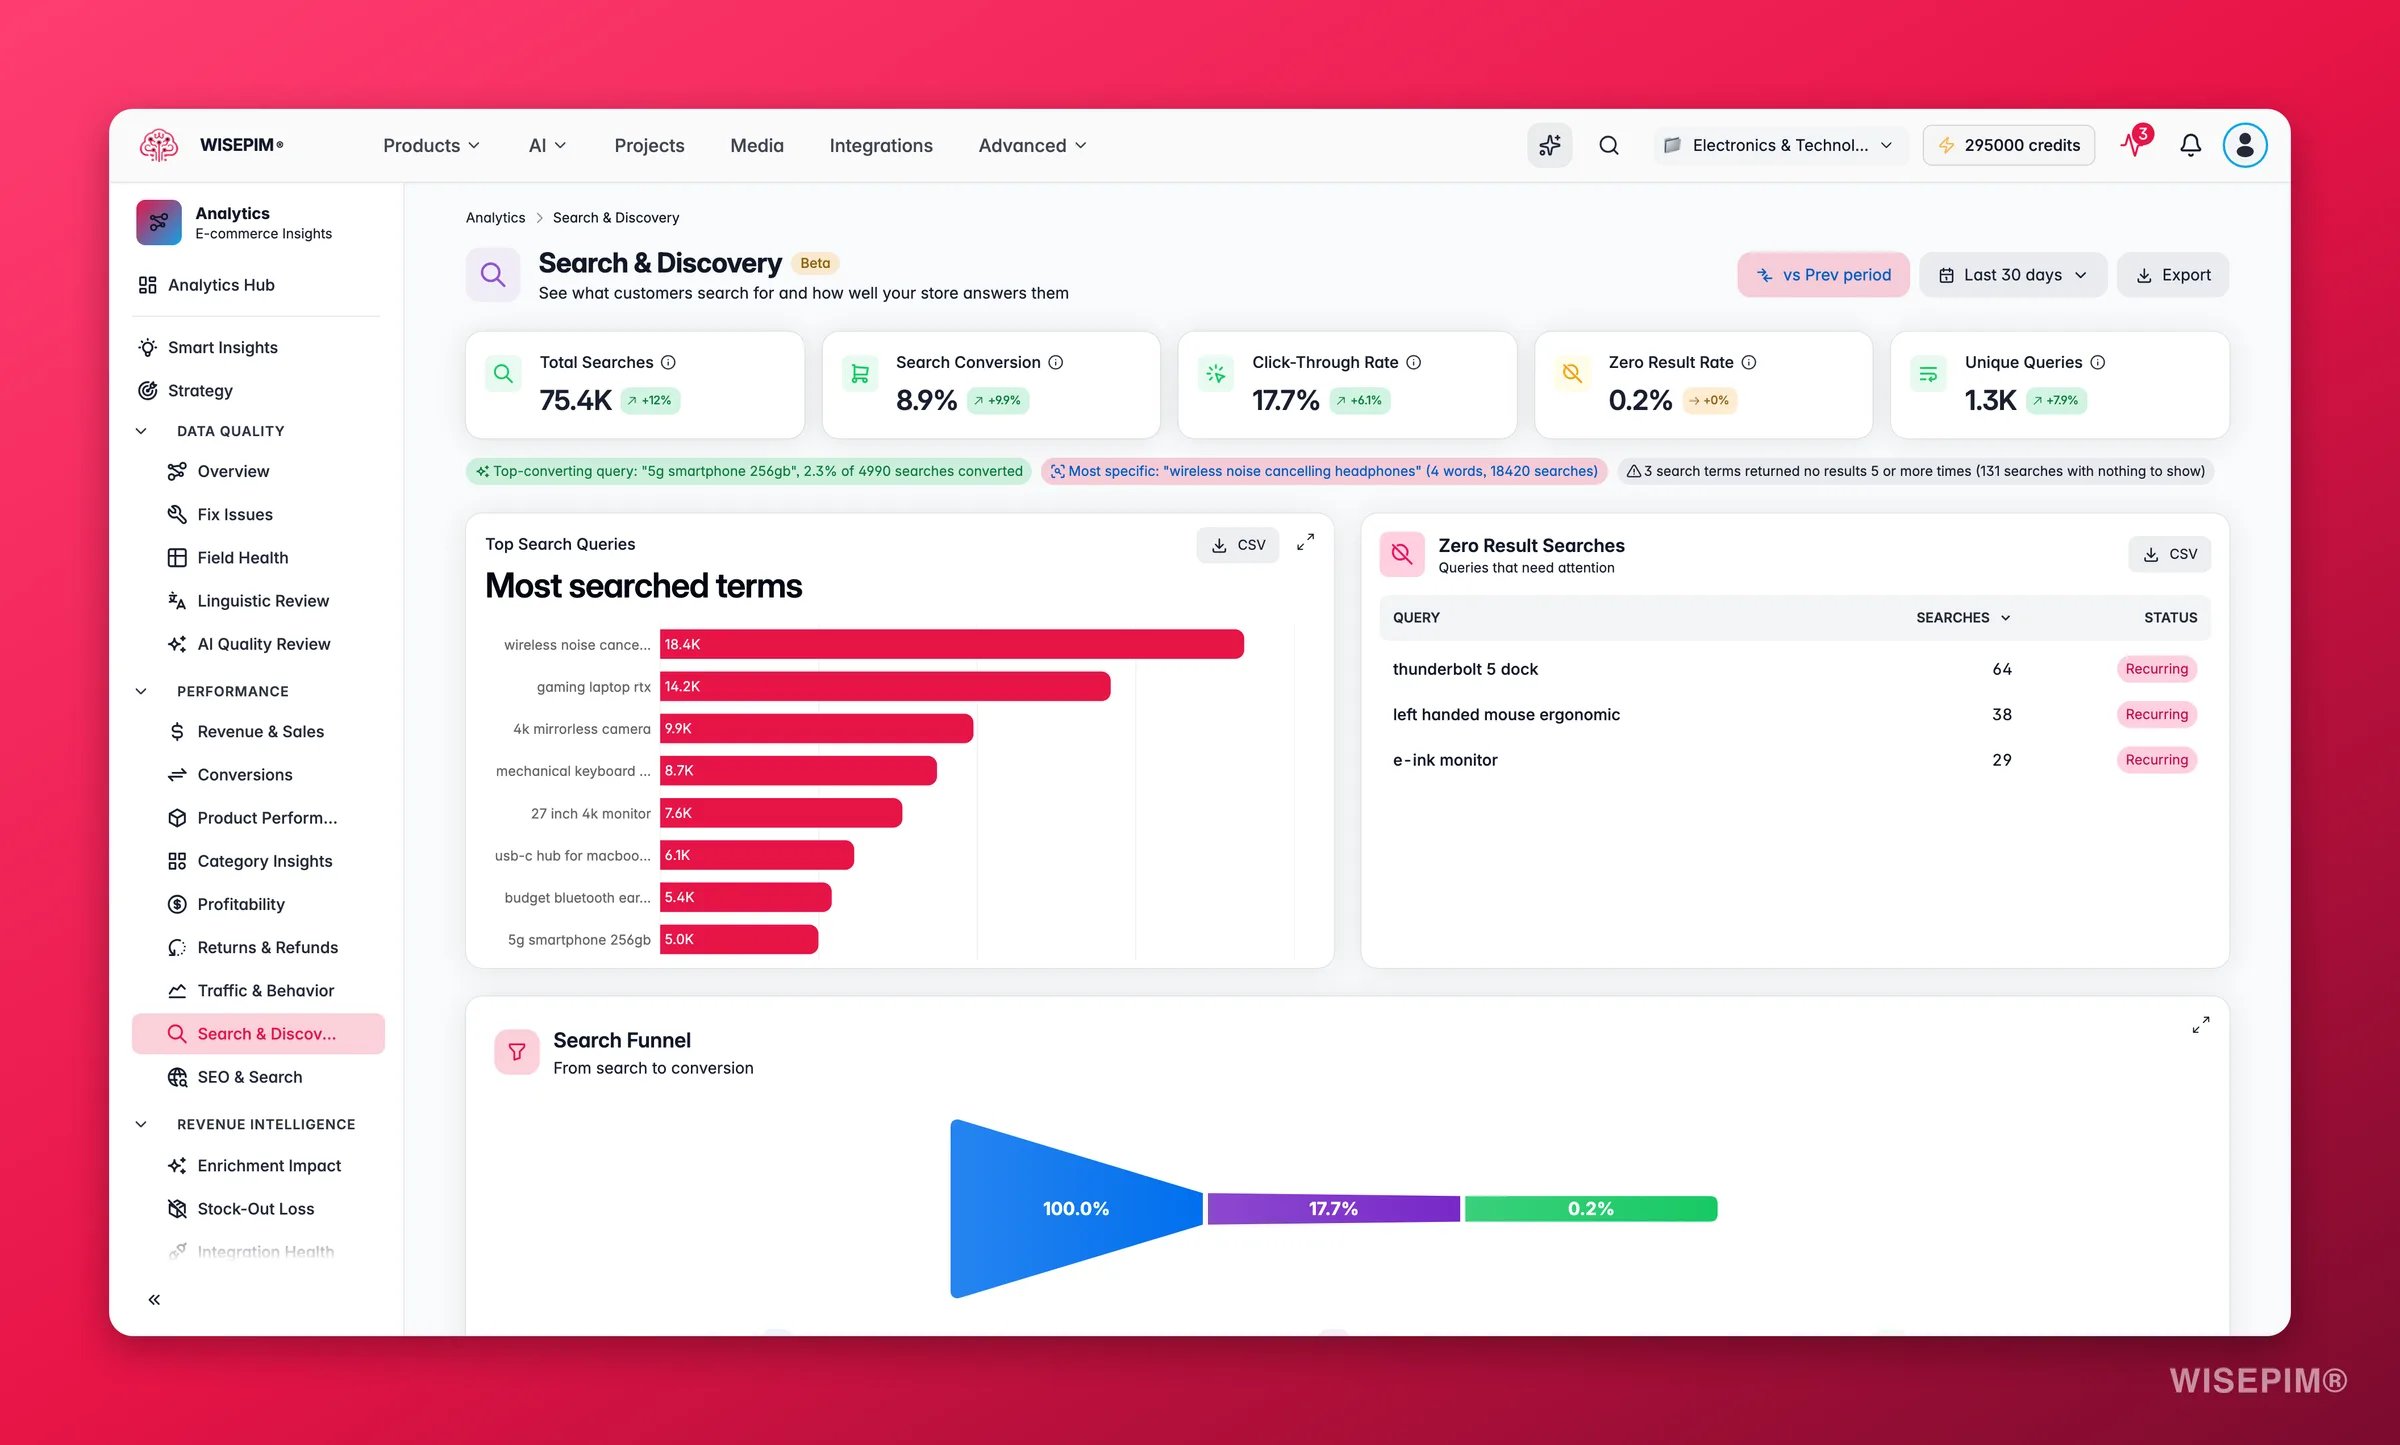
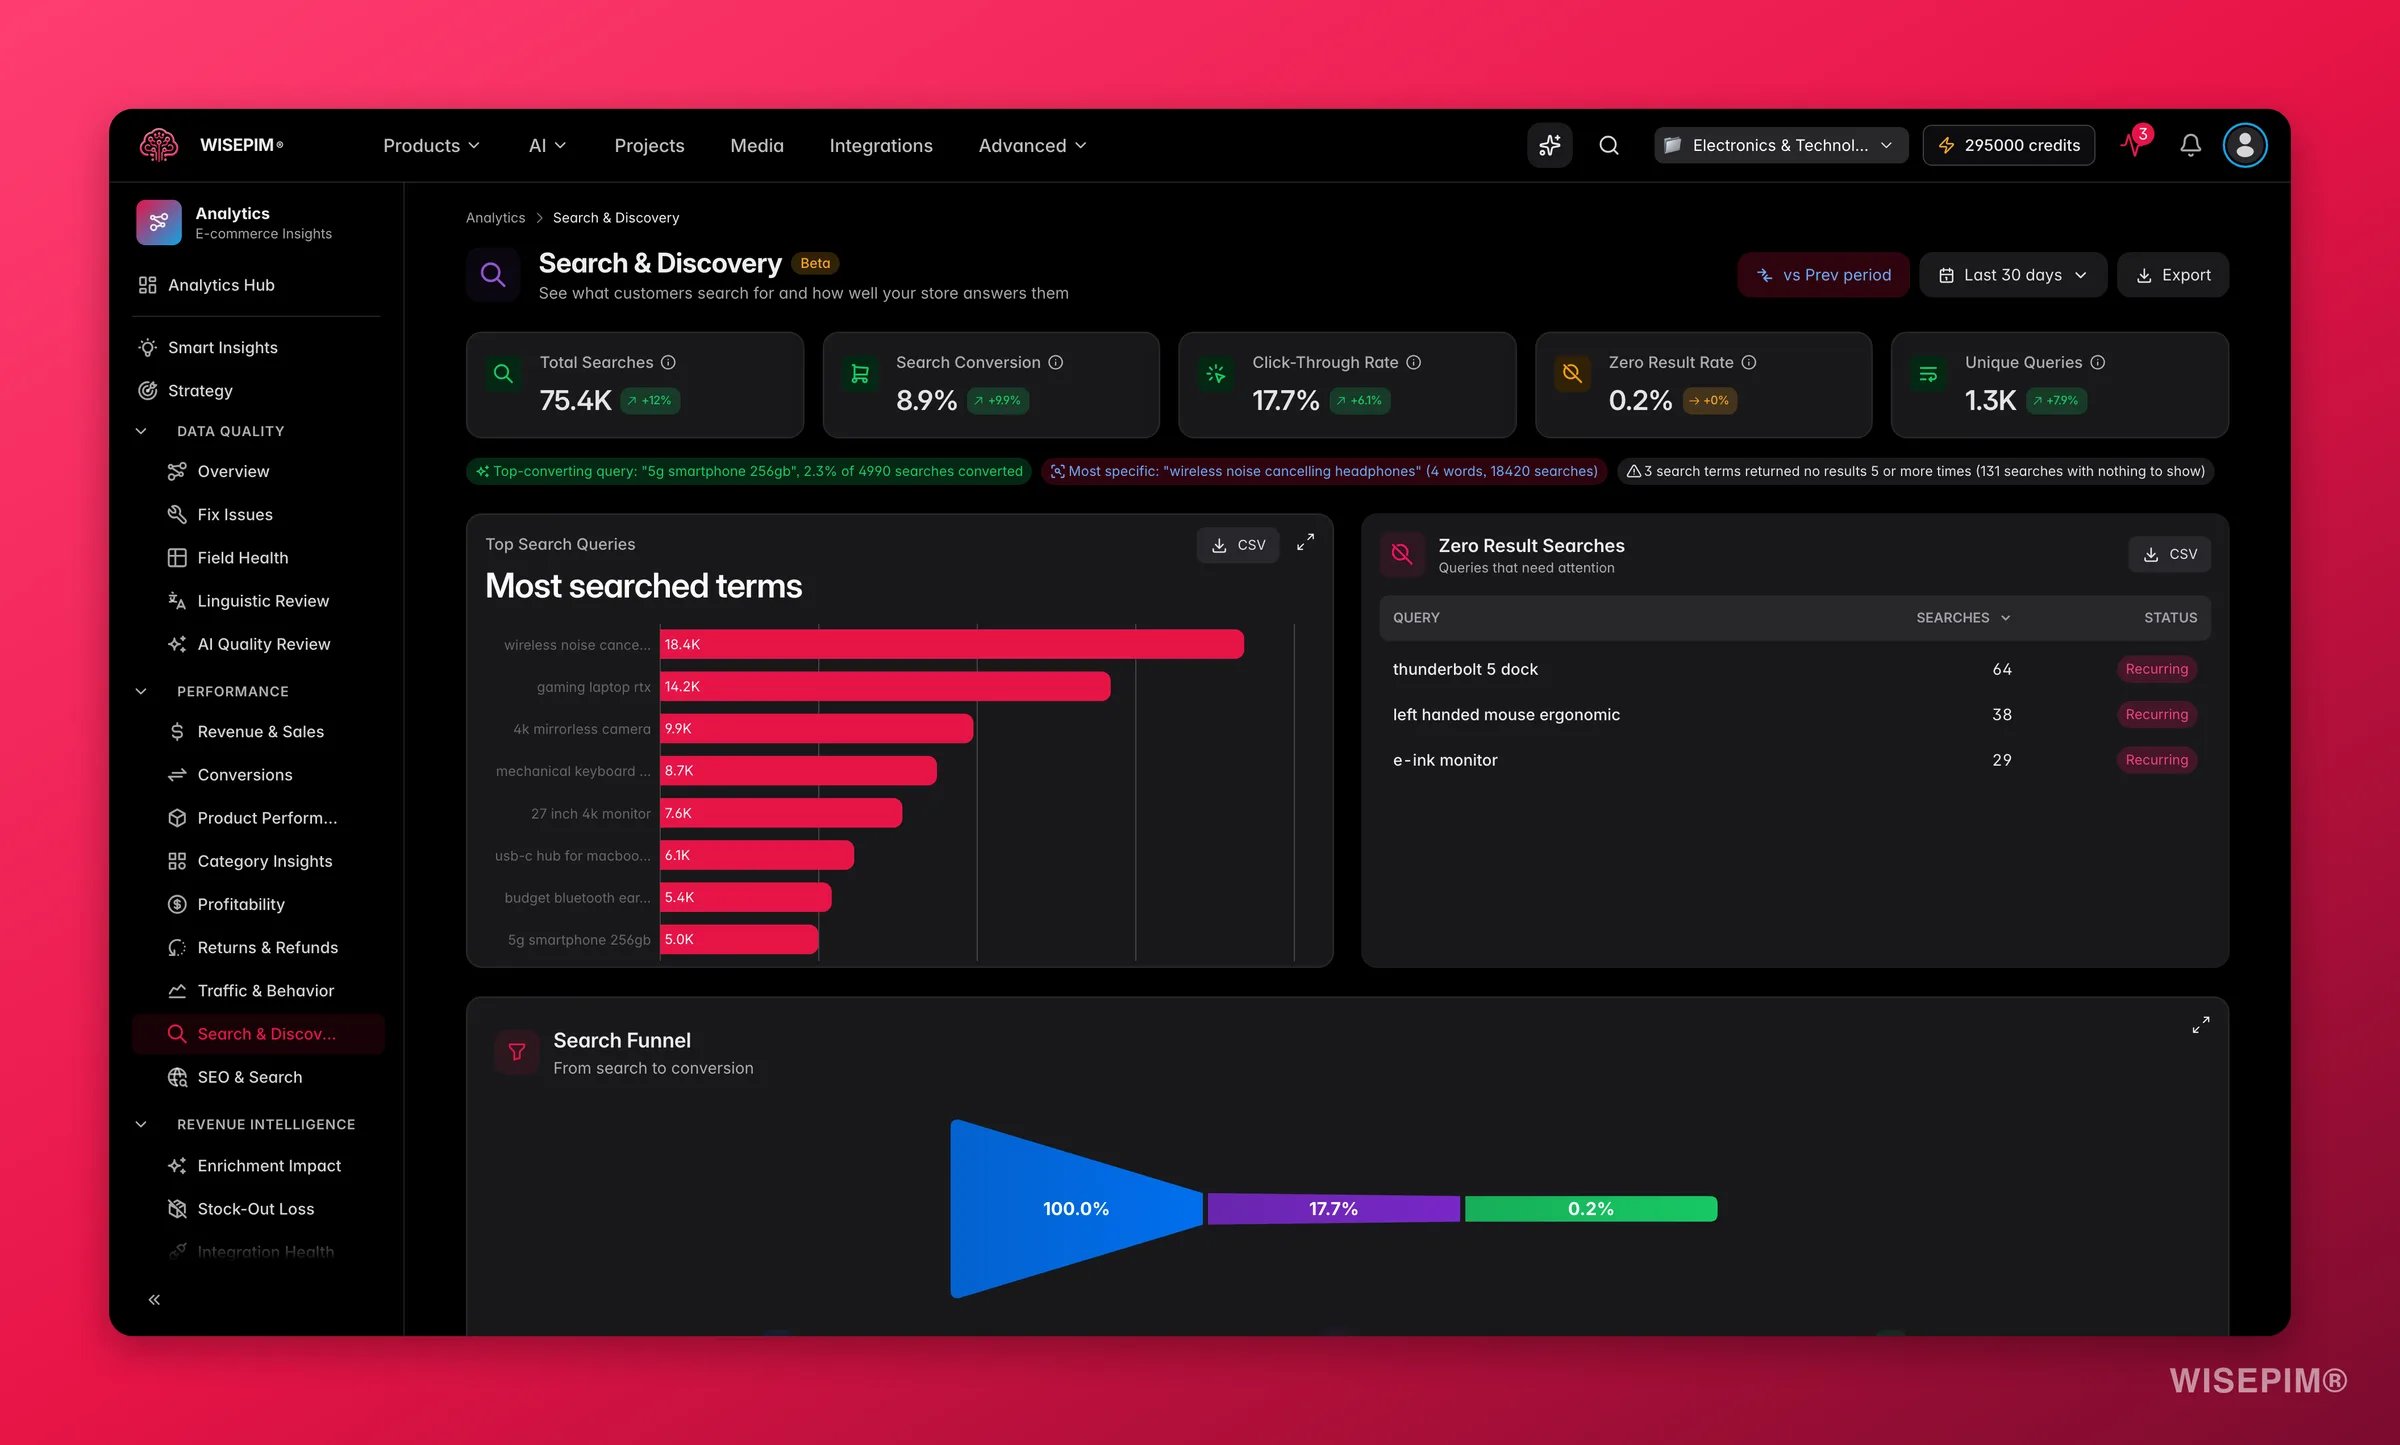 The Search & Discovery report covers **on-site search**: the search box inside your store. It tracks what shoppers type, which queries lead to a click and then a purchase, and where search comes up empty. Acting on it lets you close catalog gaps your own customers are already telling you about, lift conversion without buying more traffic, and fix zero-result failures that silently cost sales every day.
Search data requires your connected platform to track on-site search events. If search analytics look empty, check that search tracking is enabled in your platform settings. This report is separate from the SEO report, which tracks Google Search Console data for organic search visibility.
## Key metrics
Five numbers tell you how well your search experience works.
| Metric | What it tells you |
| ---------------------------- | ---------------------------------------------------------------------------------------------------------------------------------------------------------------------------------------------- |
| **Total Searches** | The number of searches in the selected period. A rising trend alongside flat conversion usually signals an intent gap, not a traffic problem. |
| **Click-through Rate (CTR)** | The share of searches where the shopper clicked at least one result. Low CTR means results look unappealing or irrelevant. |
| **Search Conversion Rate** | The share of searches that lead to a purchase. Higher means your search results help customers buy. |
| **Zero-Result Rate** | The share of searches that return nothing. Every one is a missed sale. |
| **Unique Queries** | The number of distinct search terms. A high ratio of unique queries to total searches means your catalog vocabulary is fragmented, customers reach the same products via very different words. |
Zero-result rate is your most actionable metric. Every empty search is a customer telling you exactly what they want but cannot find. Fix these first.
## Search funnel
The search funnel traces how a session moves from search intent to purchase:
**Searches → Clicks → Conversions**
Each step shows the absolute count and the drop-off rate to the next step.
| Drop-off location | What it signals | What to fix |
| ------------------------ | ----------------------------------- | ---------------------------------------------------------------------------- |
| **Searches → Clicks** | Results appear but look unappealing | Product images, titles, and price visibility in the results display |
| **Clicks → Conversions** | Product pages do not close the sale | Product descriptions, images, and pricing on pages appearing for top queries |
A healthy funnel converts 4–8% of searches directly into purchases. If you are below 2%, the issue is usually in the results display; if you are between 2–4%, the bottleneck is more often on the product page itself.
## Insight chips
Above the main charts, three insight chips highlight patterns worth acting on immediately:
* **Best-converting query**: the search term with the highest conversion rate, often revealing what your best customers are looking for.
* **Most specific query**: the longest or most detailed search term in the top queries; a signal that shoppers know exactly what they want.
* **Recurring zero-result offenders**: search terms that have returned no results across multiple days in the period. These are the most urgent gaps to close.
## Read the charts and tables
### Search volume
A sparkline shows how search volume trends over the selected period. Spikes often line up with marketing campaigns, seasonal demand, or new product launches.
### Top search queries
A bar chart ranks your most-searched terms by frequency. These are what customers care about most. Make sure they return excellent results.
### Query-length distribution
A donut chart breaks searches into three length bands:
| Band | What it suggests |
| ------------- | ---------------------------------------------------------------------------------------------------------------------------------- |
| **1 word** | Broad, exploratory intent. Customers may not know exactly what they want, or they expect autocomplete to guide them. |
| **2–3 words** | Navigational intent. The shopper has a product type in mind. |
| **4+ words** | High-intent, specific queries. Customers who search like this often convert best, and are the most disappointed when results fail. |
An interpretation card below the donut explains what your specific mix suggests and whether to invest in synonym handling, faceted search, or richer product data.
### Search by category
A donut chart shows which categories get the most search traffic. Use it to see which categories customers actively search for versus the ones they only browse.
### Discovery method
A donut chart breaks down how customers find products: direct search, category browsing, recommendations, or external links. Use it to weigh search against your other discovery paths.
### Trending searches
A table shows the search terms growing fastest in frequency. These are emerging trends: new demand, or responses to promotions and outside events.
### Search queries table
The full query table lists every search term with its performance data:
| Column | What it shows |
| ------------------- | -------------------------------------------- |
| **Query** | The search term as typed. |
| **Searches** | How many times this exact term was searched. |
| **Clicks** | How many result clicks it generated. |
| **Conversions** | How many purchases followed. |
| **Conversion Rate** | Conversions ÷ Searches. |
Sort by Conversion Rate to find your highest-intent terms. Sort by Searches to see what your customers care about most.
### Zero-result queries table
A dedicated table lists every search term that returned no results, with two columns alongside the search count:
| Column | What it shows |
| ------------ | ----------------------------------------------------------------------------------------------------------------------------------------------------------------------- |
| **Query** | The search term that returned nothing. |
| **Searches** | How many times customers searched for it. |
| **Status** | **Recurring (5+)** for terms that have returned zero results five or more times; **Review (1–4)** for terms seen fewer times. Recurring terms are the highest priority. |
## Benchmarks
Use these ranges to judge your numbers at a glance.
| Metric | Concerning | Average | Good |
| -------------------------- | ---------- | ------- | ---- |
| **Search Conversion Rate** | \<2% | 2–4% | 4–8% |
| **Zero-Result Rate** | >10% | 5–10% | \<5% |
| **Clicks per Search** | \<1 | 1–2 | 2+ |
## Act on what you find
Open the zero-result queries table and start with the **Recurring** terms, those appearing five or more times. Add synonyms, fix misspellings in your product data, or add the products customers are searching for. Use [Enrich products](/en/essentials/enriching-products) to regenerate titles and descriptions for the relevant items so they match the search vocabulary. **Outcome:** each zero-result query you fix is an unfulfilled intent you convert into a potential sale.
Your results appear but customers do not click them. The fix is usually product titles and images, not catalog gaps. Use [Enrich products](/en/essentials/enriching-products) to rewrite titles for your top-searched terms so they match the shopper's language and highlight the key attributes. **Outcome:** higher CTR means more revenue from the same traffic without any ad spend.
Results are clicked but do not lead to a purchase. The bottleneck is the product page. Improve product descriptions, images, and pricing for the products that appear in your top queries. Run a [Data Quality](/en/analytics/data-quality) check to identify missing fields that undermine buyer confidence. **Outcome:** closing this gap turns already-engaged shoppers into buyers.
This is demand you are not yet serving. Add products to fill the gap, or update existing product titles and descriptions so they match the trending term. **Outcome:** capturing emerging demand early means you rank before competitors do.
Shoppers know exactly what they want but cannot find it. This points to catalog gaps or weak attribute data, missing dimensions, specs, or materials that shoppers use in detailed queries. Use [Data Quality](/en/analytics/data-quality) to identify missing fields for the relevant products. **Outcome:** filling attribute gaps improves both search relevance and SEO, compounding the benefit.
This is the keyword your best customers use. Treat it as a model: what does this product page do well that others do not? Copy those patterns across your catalog. You may also find it useful as an anchor for a [product family](/en/products/product-families) to surface related items. **Outcome:** spreading best-performing content patterns can lift your average conversion rate catalog-wide.
## Related
See the broader picture of how visitors navigate and engage with your store.
Understand how search discovery connects to your overall conversion funnel.
Check whether the products customers search for are actually your best performers.
Track organic search visibility in Google via Search Console data.
The Search & Discovery report covers **on-site search**: the search box inside your store. It tracks what shoppers type, which queries lead to a click and then a purchase, and where search comes up empty. Acting on it lets you close catalog gaps your own customers are already telling you about, lift conversion without buying more traffic, and fix zero-result failures that silently cost sales every day.
Search data requires your connected platform to track on-site search events. If search analytics look empty, check that search tracking is enabled in your platform settings. This report is separate from the SEO report, which tracks Google Search Console data for organic search visibility.
## Key metrics
Five numbers tell you how well your search experience works.
| Metric | What it tells you |
| ---------------------------- | ---------------------------------------------------------------------------------------------------------------------------------------------------------------------------------------------- |
| **Total Searches** | The number of searches in the selected period. A rising trend alongside flat conversion usually signals an intent gap, not a traffic problem. |
| **Click-through Rate (CTR)** | The share of searches where the shopper clicked at least one result. Low CTR means results look unappealing or irrelevant. |
| **Search Conversion Rate** | The share of searches that lead to a purchase. Higher means your search results help customers buy. |
| **Zero-Result Rate** | The share of searches that return nothing. Every one is a missed sale. |
| **Unique Queries** | The number of distinct search terms. A high ratio of unique queries to total searches means your catalog vocabulary is fragmented, customers reach the same products via very different words. |
Zero-result rate is your most actionable metric. Every empty search is a customer telling you exactly what they want but cannot find. Fix these first.
## Search funnel
The search funnel traces how a session moves from search intent to purchase:
**Searches → Clicks → Conversions**
Each step shows the absolute count and the drop-off rate to the next step.
| Drop-off location | What it signals | What to fix |
| ------------------------ | ----------------------------------- | ---------------------------------------------------------------------------- |
| **Searches → Clicks** | Results appear but look unappealing | Product images, titles, and price visibility in the results display |
| **Clicks → Conversions** | Product pages do not close the sale | Product descriptions, images, and pricing on pages appearing for top queries |
A healthy funnel converts 4–8% of searches directly into purchases. If you are below 2%, the issue is usually in the results display; if you are between 2–4%, the bottleneck is more often on the product page itself.
## Insight chips
Above the main charts, three insight chips highlight patterns worth acting on immediately:
* **Best-converting query**: the search term with the highest conversion rate, often revealing what your best customers are looking for.
* **Most specific query**: the longest or most detailed search term in the top queries; a signal that shoppers know exactly what they want.
* **Recurring zero-result offenders**: search terms that have returned no results across multiple days in the period. These are the most urgent gaps to close.
## Read the charts and tables
### Search volume
A sparkline shows how search volume trends over the selected period. Spikes often line up with marketing campaigns, seasonal demand, or new product launches.
### Top search queries
A bar chart ranks your most-searched terms by frequency. These are what customers care about most. Make sure they return excellent results.
### Query-length distribution
A donut chart breaks searches into three length bands:
| Band | What it suggests |
| ------------- | ---------------------------------------------------------------------------------------------------------------------------------- |
| **1 word** | Broad, exploratory intent. Customers may not know exactly what they want, or they expect autocomplete to guide them. |
| **2–3 words** | Navigational intent. The shopper has a product type in mind. |
| **4+ words** | High-intent, specific queries. Customers who search like this often convert best, and are the most disappointed when results fail. |
An interpretation card below the donut explains what your specific mix suggests and whether to invest in synonym handling, faceted search, or richer product data.
### Search by category
A donut chart shows which categories get the most search traffic. Use it to see which categories customers actively search for versus the ones they only browse.
### Discovery method
A donut chart breaks down how customers find products: direct search, category browsing, recommendations, or external links. Use it to weigh search against your other discovery paths.
### Trending searches
A table shows the search terms growing fastest in frequency. These are emerging trends: new demand, or responses to promotions and outside events.
### Search queries table
The full query table lists every search term with its performance data:
| Column | What it shows |
| ------------------- | -------------------------------------------- |
| **Query** | The search term as typed. |
| **Searches** | How many times this exact term was searched. |
| **Clicks** | How many result clicks it generated. |
| **Conversions** | How many purchases followed. |
| **Conversion Rate** | Conversions ÷ Searches. |
Sort by Conversion Rate to find your highest-intent terms. Sort by Searches to see what your customers care about most.
### Zero-result queries table
A dedicated table lists every search term that returned no results, with two columns alongside the search count:
| Column | What it shows |
| ------------ | ----------------------------------------------------------------------------------------------------------------------------------------------------------------------- |
| **Query** | The search term that returned nothing. |
| **Searches** | How many times customers searched for it. |
| **Status** | **Recurring (5+)** for terms that have returned zero results five or more times; **Review (1–4)** for terms seen fewer times. Recurring terms are the highest priority. |
## Benchmarks
Use these ranges to judge your numbers at a glance.
| Metric | Concerning | Average | Good |
| -------------------------- | ---------- | ------- | ---- |
| **Search Conversion Rate** | \<2% | 2–4% | 4–8% |
| **Zero-Result Rate** | >10% | 5–10% | \<5% |
| **Clicks per Search** | \<1 | 1–2 | 2+ |
## Act on what you find
Open the zero-result queries table and start with the **Recurring** terms, those appearing five or more times. Add synonyms, fix misspellings in your product data, or add the products customers are searching for. Use [Enrich products](/en/essentials/enriching-products) to regenerate titles and descriptions for the relevant items so they match the search vocabulary. **Outcome:** each zero-result query you fix is an unfulfilled intent you convert into a potential sale.
Your results appear but customers do not click them. The fix is usually product titles and images, not catalog gaps. Use [Enrich products](/en/essentials/enriching-products) to rewrite titles for your top-searched terms so they match the shopper's language and highlight the key attributes. **Outcome:** higher CTR means more revenue from the same traffic without any ad spend.
Results are clicked but do not lead to a purchase. The bottleneck is the product page. Improve product descriptions, images, and pricing for the products that appear in your top queries. Run a [Data Quality](/en/analytics/data-quality) check to identify missing fields that undermine buyer confidence. **Outcome:** closing this gap turns already-engaged shoppers into buyers.
This is demand you are not yet serving. Add products to fill the gap, or update existing product titles and descriptions so they match the trending term. **Outcome:** capturing emerging demand early means you rank before competitors do.
Shoppers know exactly what they want but cannot find it. This points to catalog gaps or weak attribute data, missing dimensions, specs, or materials that shoppers use in detailed queries. Use [Data Quality](/en/analytics/data-quality) to identify missing fields for the relevant products. **Outcome:** filling attribute gaps improves both search relevance and SEO, compounding the benefit.
This is the keyword your best customers use. Treat it as a model: what does this product page do well that others do not? Copy those patterns across your catalog. You may also find it useful as an anchor for a [product family](/en/products/product-families) to surface related items. **Outcome:** spreading best-performing content patterns can lift your average conversion rate catalog-wide.
## Related
See the broader picture of how visitors navigate and engage with your store.
Understand how search discovery connects to your overall conversion funnel.
Check whether the products customers search for are actually your best performers.
Track organic search visibility in Google via Search Console data.