> ## Documentation Index
> Fetch the complete documentation index at: https://docs.wisepim.com/llms.txt
> Use this file to discover all available pages before exploring further.
# Profitability
> Revenue is vanity, margin is sanity. See real gross profit and margin by product and category, and catch anything selling below cost.
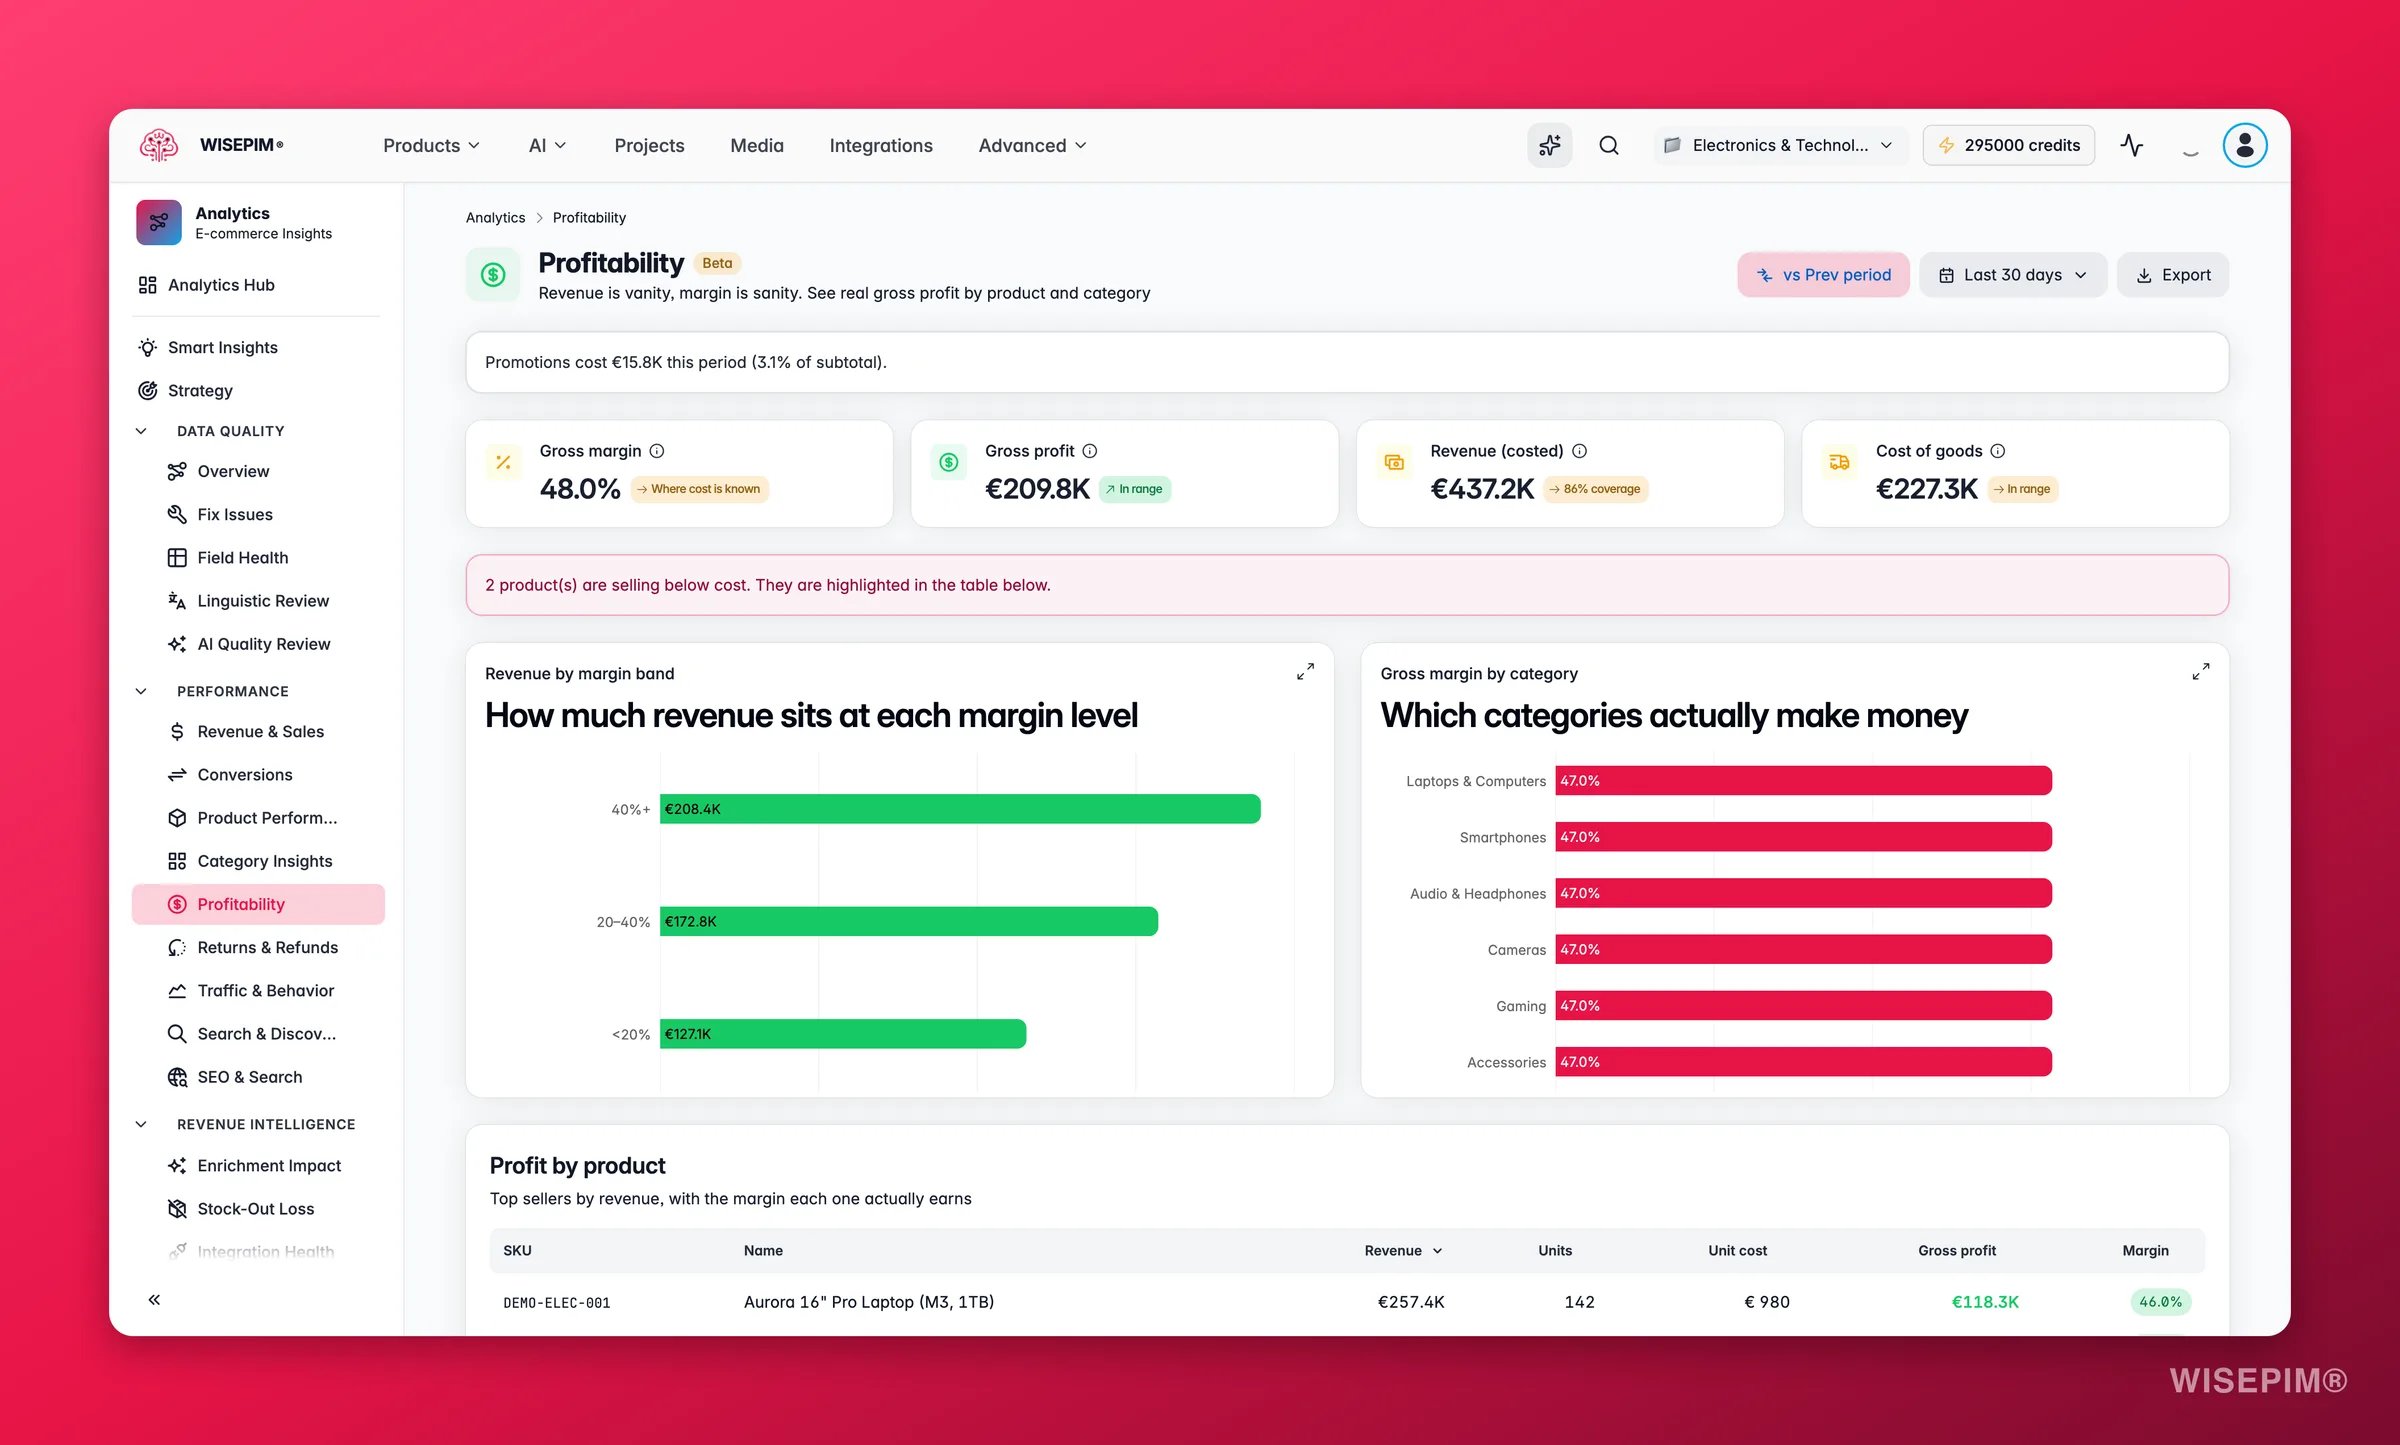
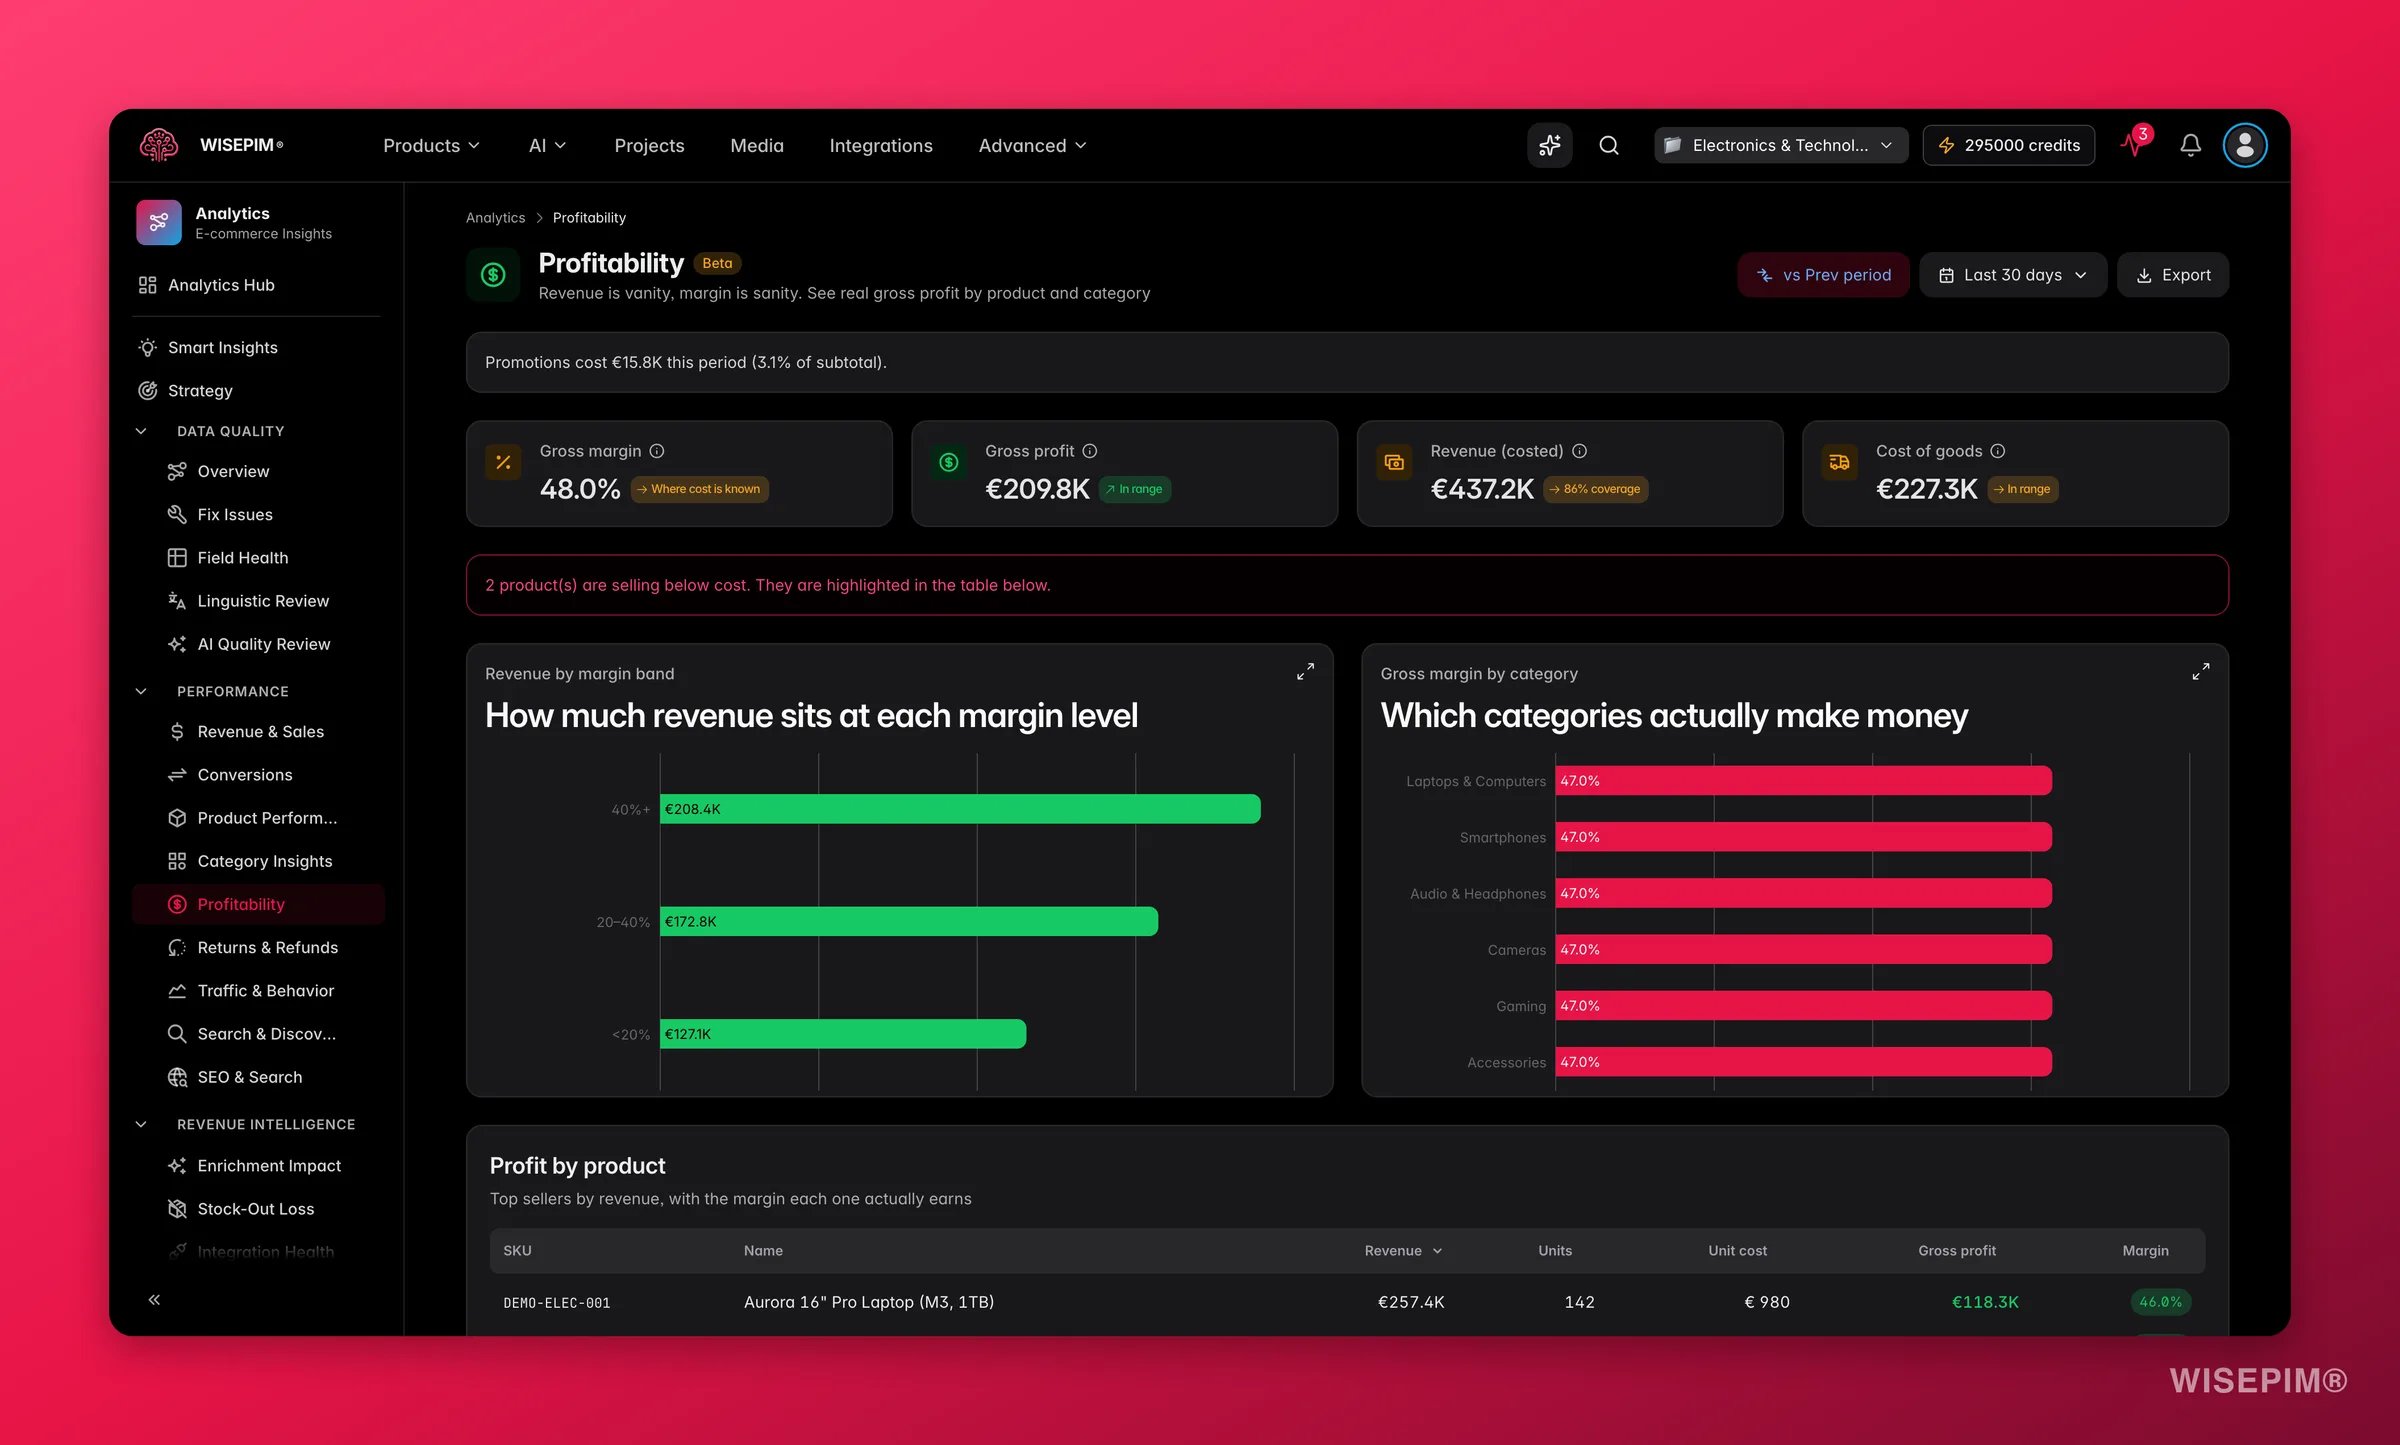
The Profitability report shows the money you actually keep. It pairs your sales with product costs to reveal gross profit and margin by product and by category, so you can grow the lines that pay and fix the ones that do not.
**What acting on it enables:** find margin leaks before they compound, stop selling bestsellers below cost, and shift promotion budget toward the categories that actually generate profit.
This report needs order history **and** a cost price on your products. Set costs in the product editor or in bulk with [Cost & Margins](/en/essentials/bulk-editing/cost-margins). Products without a cost are excluded from margin math and shown as uncosted.
## Key metrics
 | Metric | What it tells you |
| -------------------- | ---------------------------------------------------------------------------------- |
| **Gross margin %** | Gross profit as a share of costed revenue. The headline number to track over time. |
| **Gross profit** | Revenue minus cost of goods sold, in your currency. |
| **Revenue (costed)** | The share of revenue that has a cost set, shows how complete the picture is. |
| **COGS** | Total cost of goods sold across the period. |
### What good looks like
Gross margin benchmarks vary significantly by industry and business model, but these ranges give a directional sense:
| Gross margin % | Signal |
| -------------- | ---------------------------------------------------------------------------------------- |
| 50 %+ | Strong, typical for software, cosmetics, or high-end DTC brands |
| 30 – 50 % | Healthy, common in general e-commerce and branded goods |
| 15 – 30 % | Thin, margin pressure; worth reviewing pricing and supplier costs |
| Under 15 % | Concerning, typical for low-margin commodities; easily wiped out by returns or discounts |
| Below 0 % | Immediate action needed, products are selling below cost |
The report uses the same thresholds internally: the margin chip turns **warning** below 15 % and **danger** below 0 %.
If a large share of revenue has no cost set, the report flags it. Your margin is only as accurate as your cost data, fill the gaps first before drawing conclusions.
## Charts and tables
* **Revenue by margin band**: groups sales into margin buckets so you see how much revenue is high-margin versus thin. A healthy catalog has the bulk of revenue in the 30 %+ bands.
* **Gross margin % by category**: your most and least profitable categories at a glance. Use it to spot one category dragging down the blended average.
* **Profit by product**: a sortable table with revenue, units, unit cost, gross profit, and margin %. Products selling **below cost** are flagged in red so you can act immediately.
Sort the product table by gross profit, not revenue. Your best-selling product is not always your most profitable one, a high-volume SKU with a thin margin can actually be your biggest profit leak.
## Reading the results
* **A spike of revenue in the low-margin band** usually means a promotional period, a supplier cost increase, or a pricing error on a bestseller. Cross-reference with the date selector.
* **One category pulling the blended margin down** shows where to focus cost renegotiation or price adjustments first.
* **Products flagged in red** are selling below cost. Even a handful of these erases profit across the catalog if they are high-volume.
* **Low cost coverage** (many products missing cost data) means the margin figure is optimistic. The banner appears automatically when coverage drops below 80 %.
## Act on what you find
Open the flagged product in the editor and correct the cost or the price. If several SKUs from one supplier are affected, use [Cost & Margins](/en/essentials/bulk-editing/cost-margins) to update costs in bulk. A single mispriced bestseller can quietly erase profit across the catalog, act on these immediately. **Outcome:** stop the margin bleed on those SKUs within the same trading period.
Check whether the issue is cost price (negotiate with the supplier), selling price (test a price increase), or discount pressure (reduce promotions on these lines). Shift marketing spend toward your higher-margin categories. Use [Bulk Editing](/en/essentials/bulk-editing/cost-margins) to update margins across the category at once. **Outcome:** improve blended gross margin without needing to grow top-line revenue.
Import cost prices in bulk with [Cost & Margins](/en/essentials/bulk-editing/cost-margins) so the report reflects your whole catalog. Without costs, the margin figure is incomplete and you may be misreading where profit actually comes from. **Outcome:** a reliable margin view that covers the full catalog.
When the discount banner is active, it shows total promotion spend and the discount rate for the period. Review which products or categories are being discounted most heavily and evaluate whether the volume lift justifies the margin cost. You can automate conditional discounting rules with [Automations](/en/automations/overview). **Outcome:** smarter promotions that protect margin while still driving conversions.
## Related
The top-line revenue behind the margin.
Set cost prices across many products at once.
Returns eat into margin. See where they come from.
The profit you miss when bestsellers go out of stock.
| Metric | What it tells you |
| -------------------- | ---------------------------------------------------------------------------------- |
| **Gross margin %** | Gross profit as a share of costed revenue. The headline number to track over time. |
| **Gross profit** | Revenue minus cost of goods sold, in your currency. |
| **Revenue (costed)** | The share of revenue that has a cost set, shows how complete the picture is. |
| **COGS** | Total cost of goods sold across the period. |
### What good looks like
Gross margin benchmarks vary significantly by industry and business model, but these ranges give a directional sense:
| Gross margin % | Signal |
| -------------- | ---------------------------------------------------------------------------------------- |
| 50 %+ | Strong, typical for software, cosmetics, or high-end DTC brands |
| 30 – 50 % | Healthy, common in general e-commerce and branded goods |
| 15 – 30 % | Thin, margin pressure; worth reviewing pricing and supplier costs |
| Under 15 % | Concerning, typical for low-margin commodities; easily wiped out by returns or discounts |
| Below 0 % | Immediate action needed, products are selling below cost |
The report uses the same thresholds internally: the margin chip turns **warning** below 15 % and **danger** below 0 %.
If a large share of revenue has no cost set, the report flags it. Your margin is only as accurate as your cost data, fill the gaps first before drawing conclusions.
## Charts and tables
* **Revenue by margin band**: groups sales into margin buckets so you see how much revenue is high-margin versus thin. A healthy catalog has the bulk of revenue in the 30 %+ bands.
* **Gross margin % by category**: your most and least profitable categories at a glance. Use it to spot one category dragging down the blended average.
* **Profit by product**: a sortable table with revenue, units, unit cost, gross profit, and margin %. Products selling **below cost** are flagged in red so you can act immediately.
Sort the product table by gross profit, not revenue. Your best-selling product is not always your most profitable one, a high-volume SKU with a thin margin can actually be your biggest profit leak.
## Reading the results
* **A spike of revenue in the low-margin band** usually means a promotional period, a supplier cost increase, or a pricing error on a bestseller. Cross-reference with the date selector.
* **One category pulling the blended margin down** shows where to focus cost renegotiation or price adjustments first.
* **Products flagged in red** are selling below cost. Even a handful of these erases profit across the catalog if they are high-volume.
* **Low cost coverage** (many products missing cost data) means the margin figure is optimistic. The banner appears automatically when coverage drops below 80 %.
## Act on what you find
Open the flagged product in the editor and correct the cost or the price. If several SKUs from one supplier are affected, use [Cost & Margins](/en/essentials/bulk-editing/cost-margins) to update costs in bulk. A single mispriced bestseller can quietly erase profit across the catalog, act on these immediately. **Outcome:** stop the margin bleed on those SKUs within the same trading period.
Check whether the issue is cost price (negotiate with the supplier), selling price (test a price increase), or discount pressure (reduce promotions on these lines). Shift marketing spend toward your higher-margin categories. Use [Bulk Editing](/en/essentials/bulk-editing/cost-margins) to update margins across the category at once. **Outcome:** improve blended gross margin without needing to grow top-line revenue.
Import cost prices in bulk with [Cost & Margins](/en/essentials/bulk-editing/cost-margins) so the report reflects your whole catalog. Without costs, the margin figure is incomplete and you may be misreading where profit actually comes from. **Outcome:** a reliable margin view that covers the full catalog.
When the discount banner is active, it shows total promotion spend and the discount rate for the period. Review which products or categories are being discounted most heavily and evaluate whether the volume lift justifies the margin cost. You can automate conditional discounting rules with [Automations](/en/automations/overview). **Outcome:** smarter promotions that protect margin while still driving conversions.
## Related
The top-line revenue behind the margin.
Set cost prices across many products at once.
Returns eat into margin. See where they come from.
The profit you miss when bestsellers go out of stock.