> ## Documentation Index
> Fetch the complete documentation index at: https://docs.wisepim.com/llms.txt
> Use this file to discover all available pages before exploring further.
# Marketing Attribution
> See which channels and campaigns drive your revenue. Understand where sales come from so you can focus on what actually works.
The Marketing Attribution report connects your marketing activity to real sales. It reads UTM parameters and source tags attached to orders and shows which campaigns, channels, and mediums bring in revenue. Use it to understand where your sales originate and which sources are growing.
The report's primary payoff is double-sided: it shows you which channels to invest more in, and it exposes where tagging is broken, because every untagged order is attribution you have lost. Fixing tagging coverage is often the first action, and it makes every subsequent analysis more reliable.
Attribution is revenue-based and relies on UTM tags or source tracking on your orders. The more consistently your campaigns are tagged, the more complete the picture. Ad-spend metrics (ROAS, CPA) are not shown, this report tracks revenue, not cost.
## Metrics at a glance
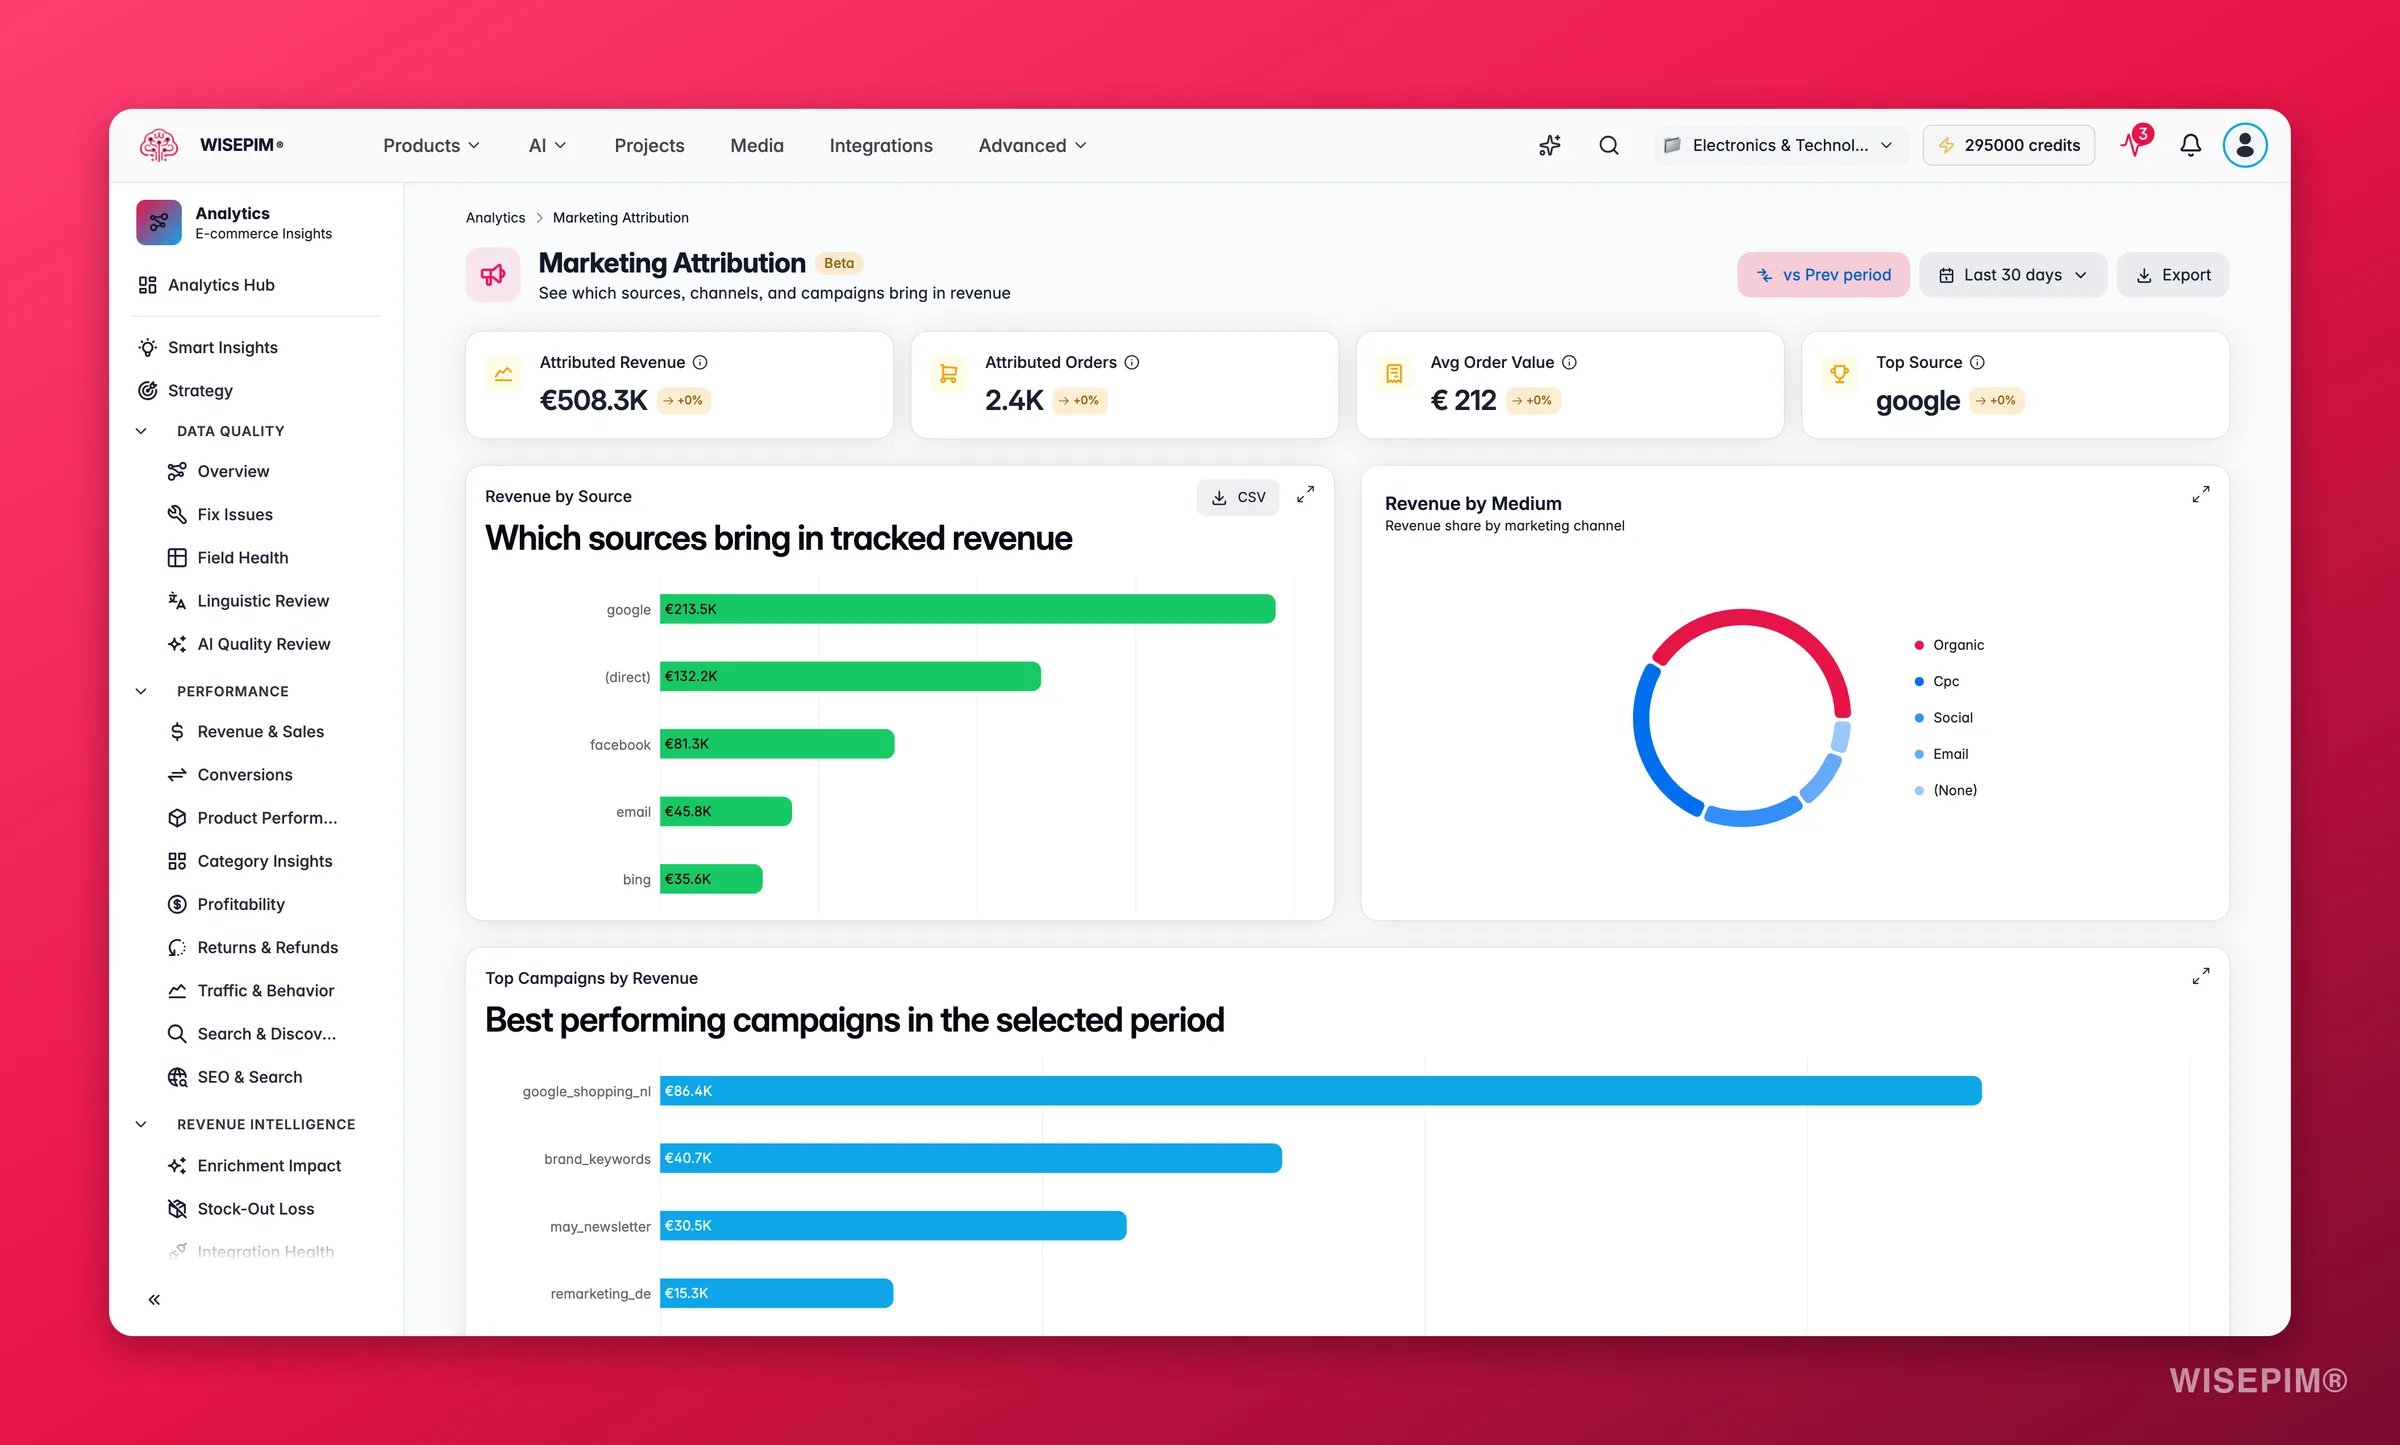
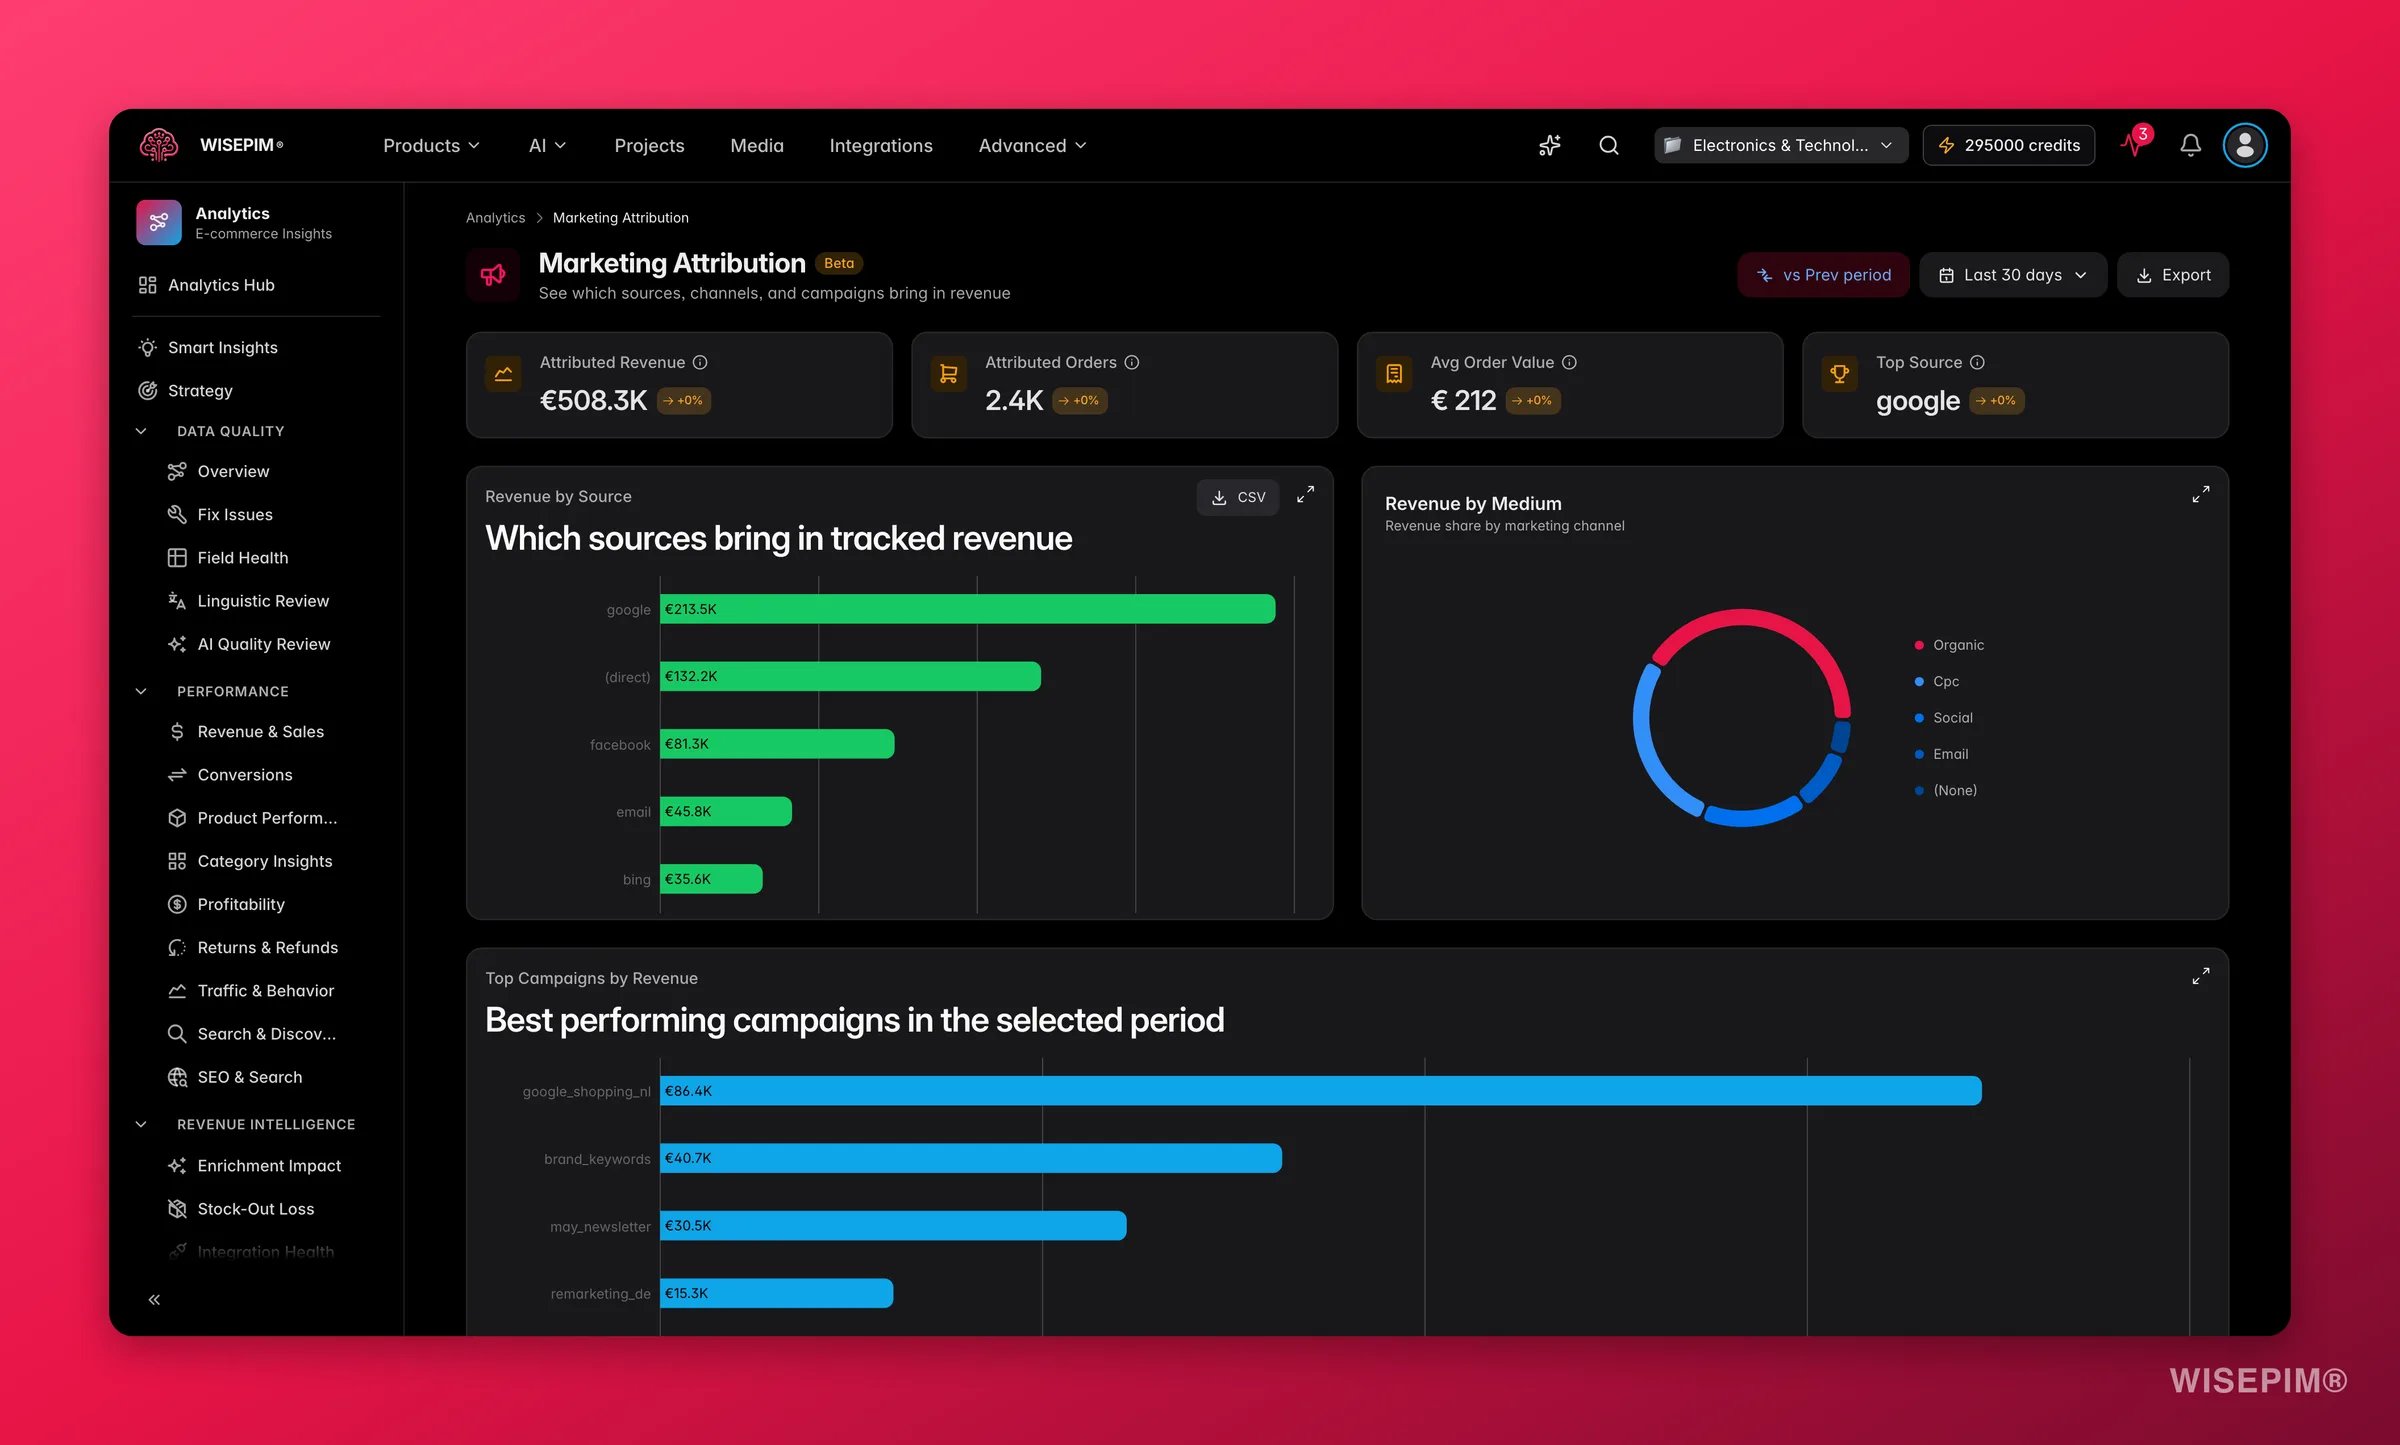 The KPI row at the top shows four numbers for the selected period:
| Metric | What it means |
| ---------------------- | ------------------------------------------------------------------------------------------------------- |
| **Attributed Revenue** | Total revenue from orders where a source, medium, or campaign could be identified. |
| **Attributed Orders** | The count of orders with a tracked source. |
| **Avg Order Value** | Average order value across attributed orders. |
| **Top Source** | The single source driving the most revenue, with its share of total attributed revenue shown alongside. |
Revenue that carries no UTM or source tag appears as "Direct / None". If this bucket is large, it often means campaign tagging is incomplete rather than that customers are coming in without a referral.
## Read the report
### Revenue by medium
A donut chart breaks attributed revenue into mediums, organic, email, cpc, referral, social, and so on. This is the fastest view for seeing which type of marketing channel is most valuable to your business overall.
Medium patterns and what they typically signal:
* **Organic dominant**: good long-term signal. SEO is working. Watch that you are not under-investing in paid channels that could accelerate growth.
* **CPC dominant**: paid search is driving revenue, but check whether organic is also growing. Heavy reliance on CPC with flat organic means stopping paid spend would expose a traffic gap.
* **Email over-indexed**: your existing customer base is buying, but new acquisition may be weak. Pair this with [Customer Insights](/en/analytics/customer-insights) to check whether new customer acquisition is healthy.
* **Referral significant**: often a sign of good partnerships or press coverage. Worth understanding who is referring and whether the relationship can be deepened.
* **Social under single digits**: common for most stores. Social rarely converts directly; it often assists. Consider this a top-of-funnel investment, not a bottom-of-funnel one.
### Top campaigns
A bar chart ranks your campaigns by attributed revenue, highest first. It complements the donut by showing individual campaign performance within and across mediums. A campaign with very high orders but low revenue per order, compared to others, often targets a low-value audience or runs on a discount-heavy angle that attracts one-time buyers.
### Campaign performance table
The table lists one row per campaign with the following columns:
| Column | What it shows |
| ------------ | ------------------------------------------------------------ |
| **Campaign** | The `utm_campaign` value from tagged orders. |
| **Source** | The `utm_source` value (google, newsletter, facebook, etc.). |
| **Medium** | The `utm_medium` value (cpc, email, social, etc.). |
| **Revenue** | Total attributed revenue for this campaign in the period. |
| **Orders** | Number of attributed orders from this campaign. |
Sort by Revenue to find your biggest earners, or by Orders to compare how efficiently each campaign converts volume.
## What good looks like
| Metric | Concerning | Acceptable | Healthy |
| -------------------------------- | ----------------- | ------------- | ----------- |
| **Direct / None share** | Above 40% | 20–40% | Under 20% |
| **Top source share** | Above 60% | 40–60% | Under 40% |
| **Number of attributed mediums** | 1 | 2–3 | 4 or more |
| **AOV across campaigns** | Varies 3× or more | Varies 1.5–3× | Within 1.5× |
A high Direct / None share is rarely genuine direct traffic, it almost always means UTM tagging is missing from email links, social posts, or paid campaigns. Getting that number under 20% is the single most impactful improvement you can make to the quality of this report.
## Source concentration
An insight chip above the table flags if a single source accounts for more than half of your attributed revenue. Heavy concentration on one channel is a risk: if that channel dries up or becomes more expensive, your attributed revenue can drop sharply. The chip links through to the table filtered to that source so you can see the full breakdown.
## Act on what you see
Your campaign tagging is incomplete. Start with the highest-ROI fix: audit UTM parameters on your email links, paid search ads, and social posts. Tools like UTM.io or Google's Campaign URL Builder make this quick. Add `utm_source`, `utm_medium`, and `utm_campaign` to every link you control. Once tagging improves, revenue that was "untracked" shifts into named sources and makes this report far more actionable. Outcome: better tagging coverage means every future campaign decision is based on real data rather than guesswork.
Concentration on a single source creates revenue fragility, changes to that platform's algorithm, costs, or policies can hit you immediately. Test other channels even at small budgets to diversify. Use [Traffic & Behavior](/en/analytics/traffic-behavior) to see whether sessions from other sources are arriving but not converting, a content or landing-page fix might unlock a channel that is already sending traffic. Outcome: building a second meaningful revenue source reduces dependence and creates redundancy.
The campaign is attracting low-value buyers, likely because the ad angle, audience, or offer appeals to bargain seekers. Check [Category Insights](/en/analytics/category-insights) to see which products those orders contain. If they cluster around your cheapest items, adjust targeting or creative to feature higher-value products. Outcome: shifting a high-volume campaign toward higher-value products lifts attributed revenue without requiring more spend.
First check whether tagging is in place for that medium, missing UTMs are the most common cause. If tagging is correct and revenue is genuinely low, consider whether that medium typically assists conversions rather than closes them. Use [Traffic & Behavior](/en/analytics/traffic-behavior) to see whether sessions from that medium have high engagement even if they don't convert on the first visit. Outcome: distinguishing an untagged channel from a genuinely low-performing one prevents you from cutting a channel that is actually contributing.
If organic search brings little attributed revenue, your products may not rank for the queries buyers use. Go to [SEO Analytics](/en/analytics/seo) to check keyword coverage and positions. Improving product titles, descriptions, and meta data is the fastest way to lift organic reach. See [enriching products](/en/essentials/enriching-products) for the workflow. Outcome: organic revenue is lower-cost than paid; even modest SEO improvements compound over time.
## Related
See how marketing-driven traffic behaves on your store compared to organic visitors.
Understand how marketing traffic converts through your purchase funnel.
Track whether marketing-acquired customers become repeat buyers with strong LTV.
Understand organic search visibility and improve the rankings that drive free traffic.
The KPI row at the top shows four numbers for the selected period:
| Metric | What it means |
| ---------------------- | ------------------------------------------------------------------------------------------------------- |
| **Attributed Revenue** | Total revenue from orders where a source, medium, or campaign could be identified. |
| **Attributed Orders** | The count of orders with a tracked source. |
| **Avg Order Value** | Average order value across attributed orders. |
| **Top Source** | The single source driving the most revenue, with its share of total attributed revenue shown alongside. |
Revenue that carries no UTM or source tag appears as "Direct / None". If this bucket is large, it often means campaign tagging is incomplete rather than that customers are coming in without a referral.
## Read the report
### Revenue by medium
A donut chart breaks attributed revenue into mediums, organic, email, cpc, referral, social, and so on. This is the fastest view for seeing which type of marketing channel is most valuable to your business overall.
Medium patterns and what they typically signal:
* **Organic dominant**: good long-term signal. SEO is working. Watch that you are not under-investing in paid channels that could accelerate growth.
* **CPC dominant**: paid search is driving revenue, but check whether organic is also growing. Heavy reliance on CPC with flat organic means stopping paid spend would expose a traffic gap.
* **Email over-indexed**: your existing customer base is buying, but new acquisition may be weak. Pair this with [Customer Insights](/en/analytics/customer-insights) to check whether new customer acquisition is healthy.
* **Referral significant**: often a sign of good partnerships or press coverage. Worth understanding who is referring and whether the relationship can be deepened.
* **Social under single digits**: common for most stores. Social rarely converts directly; it often assists. Consider this a top-of-funnel investment, not a bottom-of-funnel one.
### Top campaigns
A bar chart ranks your campaigns by attributed revenue, highest first. It complements the donut by showing individual campaign performance within and across mediums. A campaign with very high orders but low revenue per order, compared to others, often targets a low-value audience or runs on a discount-heavy angle that attracts one-time buyers.
### Campaign performance table
The table lists one row per campaign with the following columns:
| Column | What it shows |
| ------------ | ------------------------------------------------------------ |
| **Campaign** | The `utm_campaign` value from tagged orders. |
| **Source** | The `utm_source` value (google, newsletter, facebook, etc.). |
| **Medium** | The `utm_medium` value (cpc, email, social, etc.). |
| **Revenue** | Total attributed revenue for this campaign in the period. |
| **Orders** | Number of attributed orders from this campaign. |
Sort by Revenue to find your biggest earners, or by Orders to compare how efficiently each campaign converts volume.
## What good looks like
| Metric | Concerning | Acceptable | Healthy |
| -------------------------------- | ----------------- | ------------- | ----------- |
| **Direct / None share** | Above 40% | 20–40% | Under 20% |
| **Top source share** | Above 60% | 40–60% | Under 40% |
| **Number of attributed mediums** | 1 | 2–3 | 4 or more |
| **AOV across campaigns** | Varies 3× or more | Varies 1.5–3× | Within 1.5× |
A high Direct / None share is rarely genuine direct traffic, it almost always means UTM tagging is missing from email links, social posts, or paid campaigns. Getting that number under 20% is the single most impactful improvement you can make to the quality of this report.
## Source concentration
An insight chip above the table flags if a single source accounts for more than half of your attributed revenue. Heavy concentration on one channel is a risk: if that channel dries up or becomes more expensive, your attributed revenue can drop sharply. The chip links through to the table filtered to that source so you can see the full breakdown.
## Act on what you see
Your campaign tagging is incomplete. Start with the highest-ROI fix: audit UTM parameters on your email links, paid search ads, and social posts. Tools like UTM.io or Google's Campaign URL Builder make this quick. Add `utm_source`, `utm_medium`, and `utm_campaign` to every link you control. Once tagging improves, revenue that was "untracked" shifts into named sources and makes this report far more actionable. Outcome: better tagging coverage means every future campaign decision is based on real data rather than guesswork.
Concentration on a single source creates revenue fragility, changes to that platform's algorithm, costs, or policies can hit you immediately. Test other channels even at small budgets to diversify. Use [Traffic & Behavior](/en/analytics/traffic-behavior) to see whether sessions from other sources are arriving but not converting, a content or landing-page fix might unlock a channel that is already sending traffic. Outcome: building a second meaningful revenue source reduces dependence and creates redundancy.
The campaign is attracting low-value buyers, likely because the ad angle, audience, or offer appeals to bargain seekers. Check [Category Insights](/en/analytics/category-insights) to see which products those orders contain. If they cluster around your cheapest items, adjust targeting or creative to feature higher-value products. Outcome: shifting a high-volume campaign toward higher-value products lifts attributed revenue without requiring more spend.
First check whether tagging is in place for that medium, missing UTMs are the most common cause. If tagging is correct and revenue is genuinely low, consider whether that medium typically assists conversions rather than closes them. Use [Traffic & Behavior](/en/analytics/traffic-behavior) to see whether sessions from that medium have high engagement even if they don't convert on the first visit. Outcome: distinguishing an untagged channel from a genuinely low-performing one prevents you from cutting a channel that is actually contributing.
If organic search brings little attributed revenue, your products may not rank for the queries buyers use. Go to [SEO Analytics](/en/analytics/seo) to check keyword coverage and positions. Improving product titles, descriptions, and meta data is the fastest way to lift organic reach. See [enriching products](/en/essentials/enriching-products) for the workflow. Outcome: organic revenue is lower-cost than paid; even modest SEO improvements compound over time.
## Related
See how marketing-driven traffic behaves on your store compared to organic visitors.
Understand how marketing traffic converts through your purchase funnel.
Track whether marketing-acquired customers become repeat buyers with strong LTV.
Understand organic search visibility and improve the rankings that drive free traffic.