> ## Documentation Index
> Fetch the complete documentation index at: https://docs.wisepim.com/llms.txt
> Use this file to discover all available pages before exploring further.
# Data Quality Analytics
> Grade, score, and fix your product data across three views: Overview, Fix Issues, and Field Health. Spot quick wins, track progress, and see the impact of every improvement.
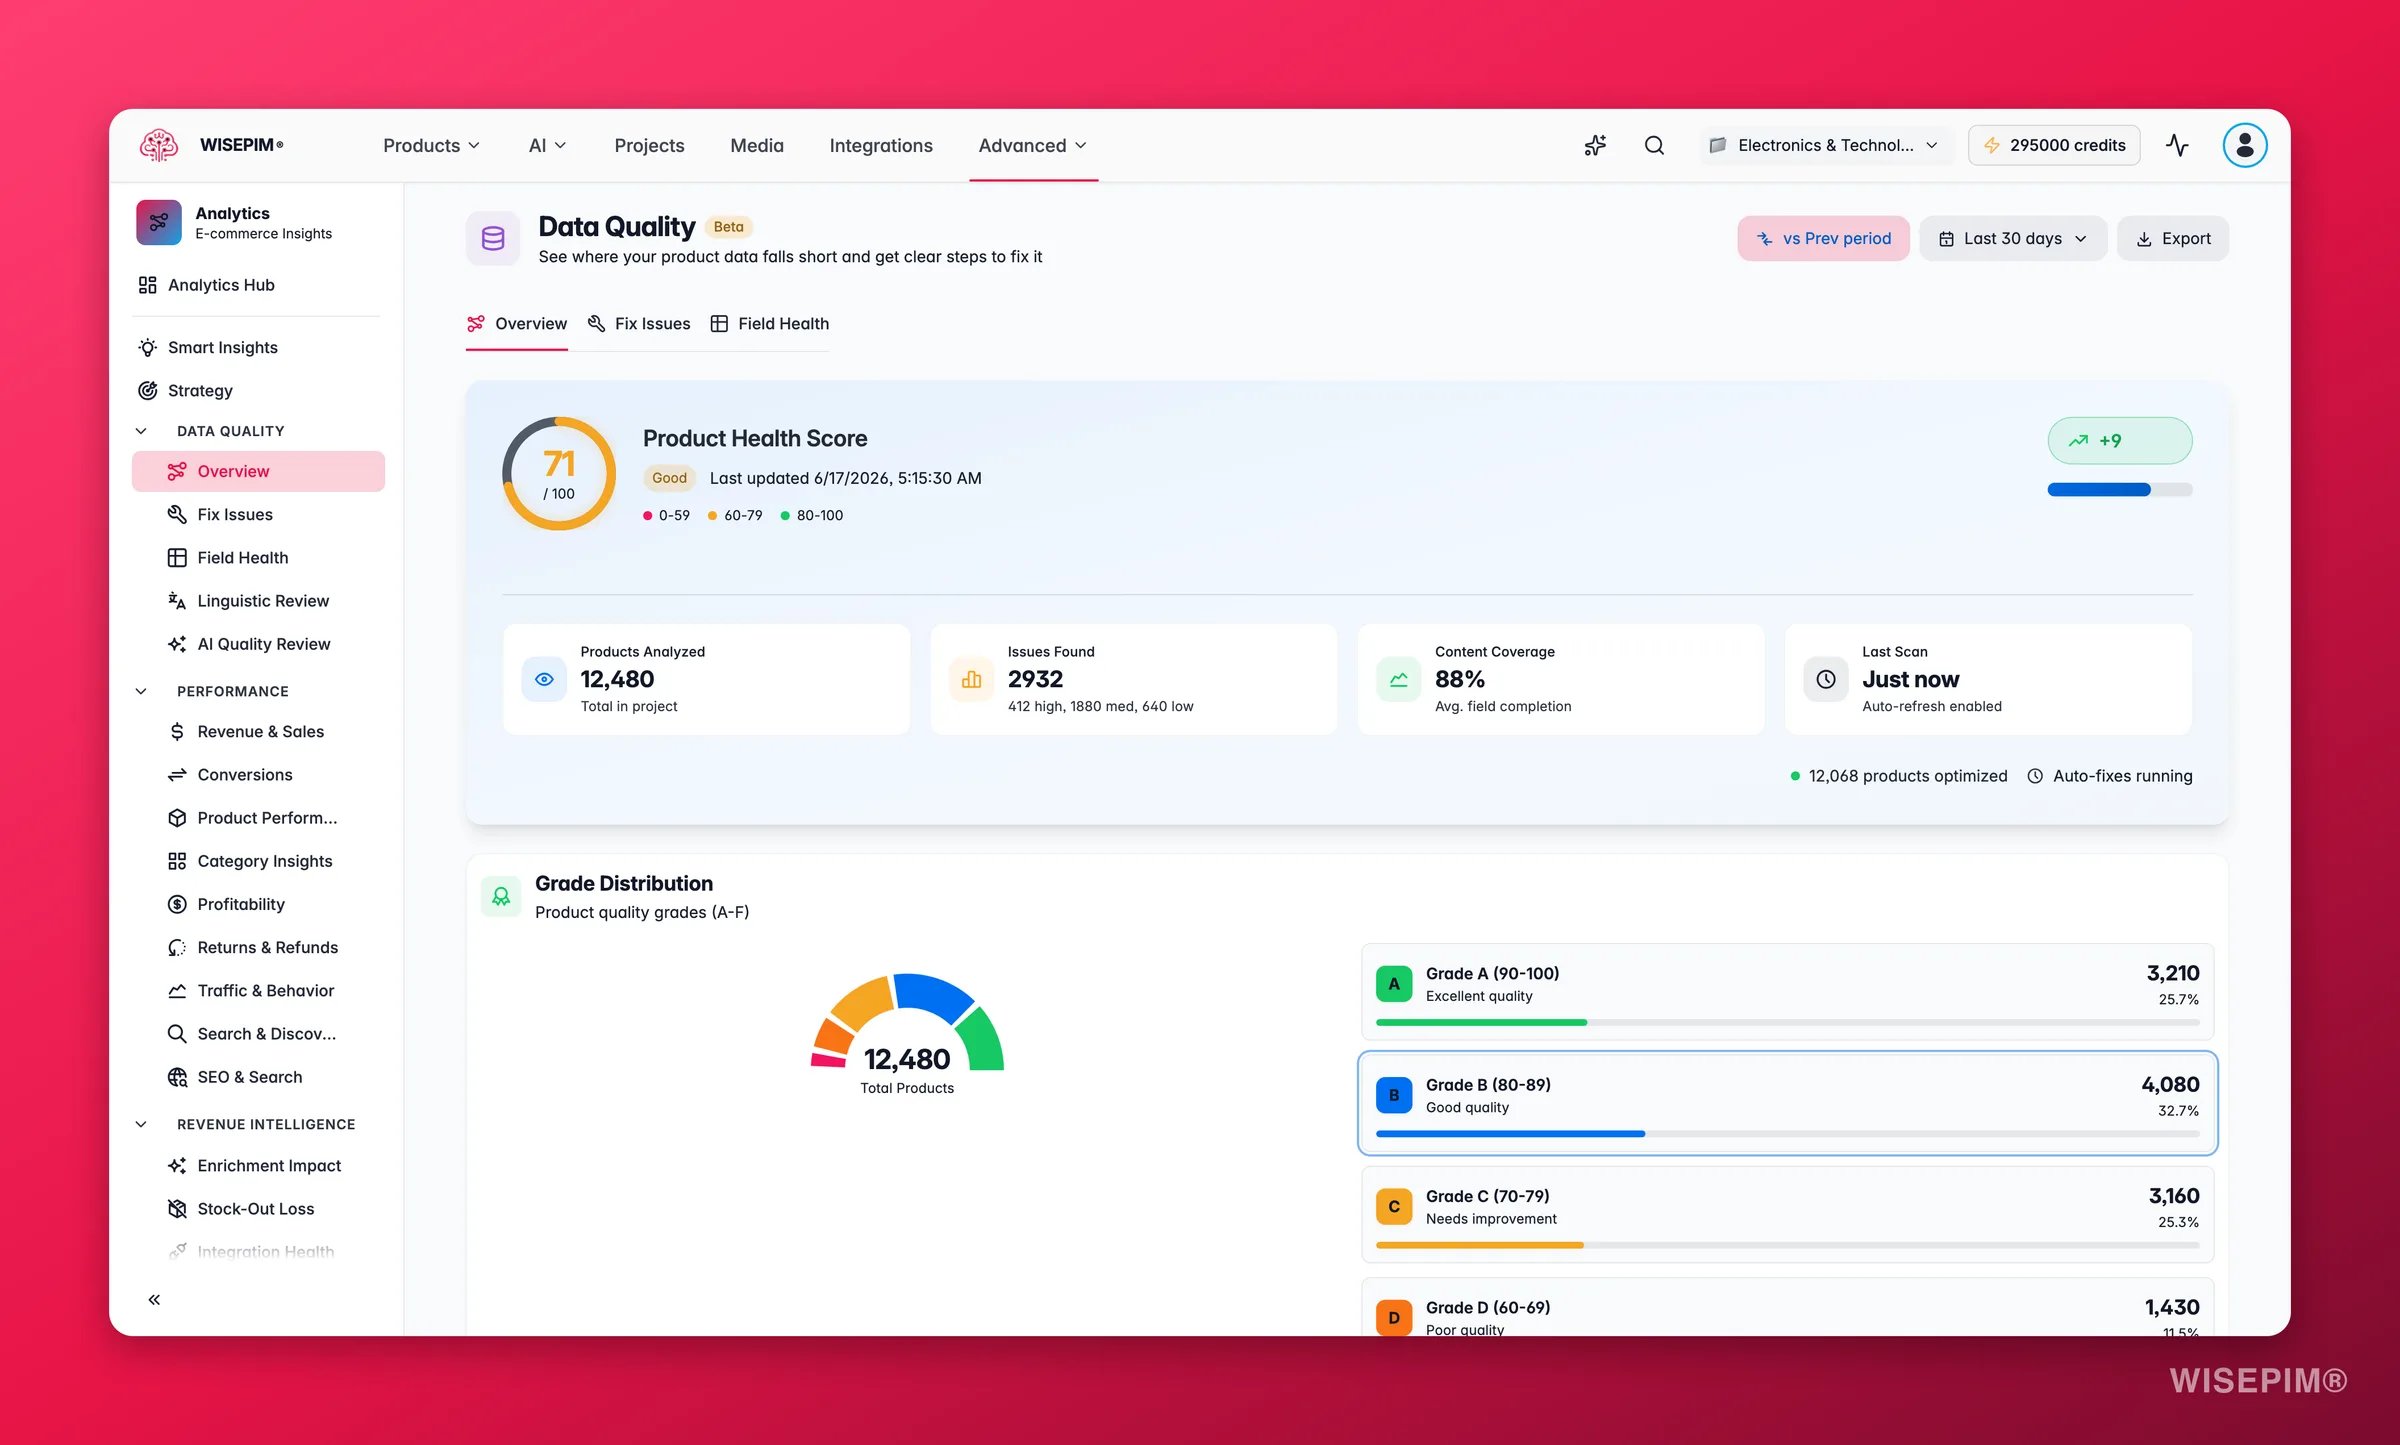
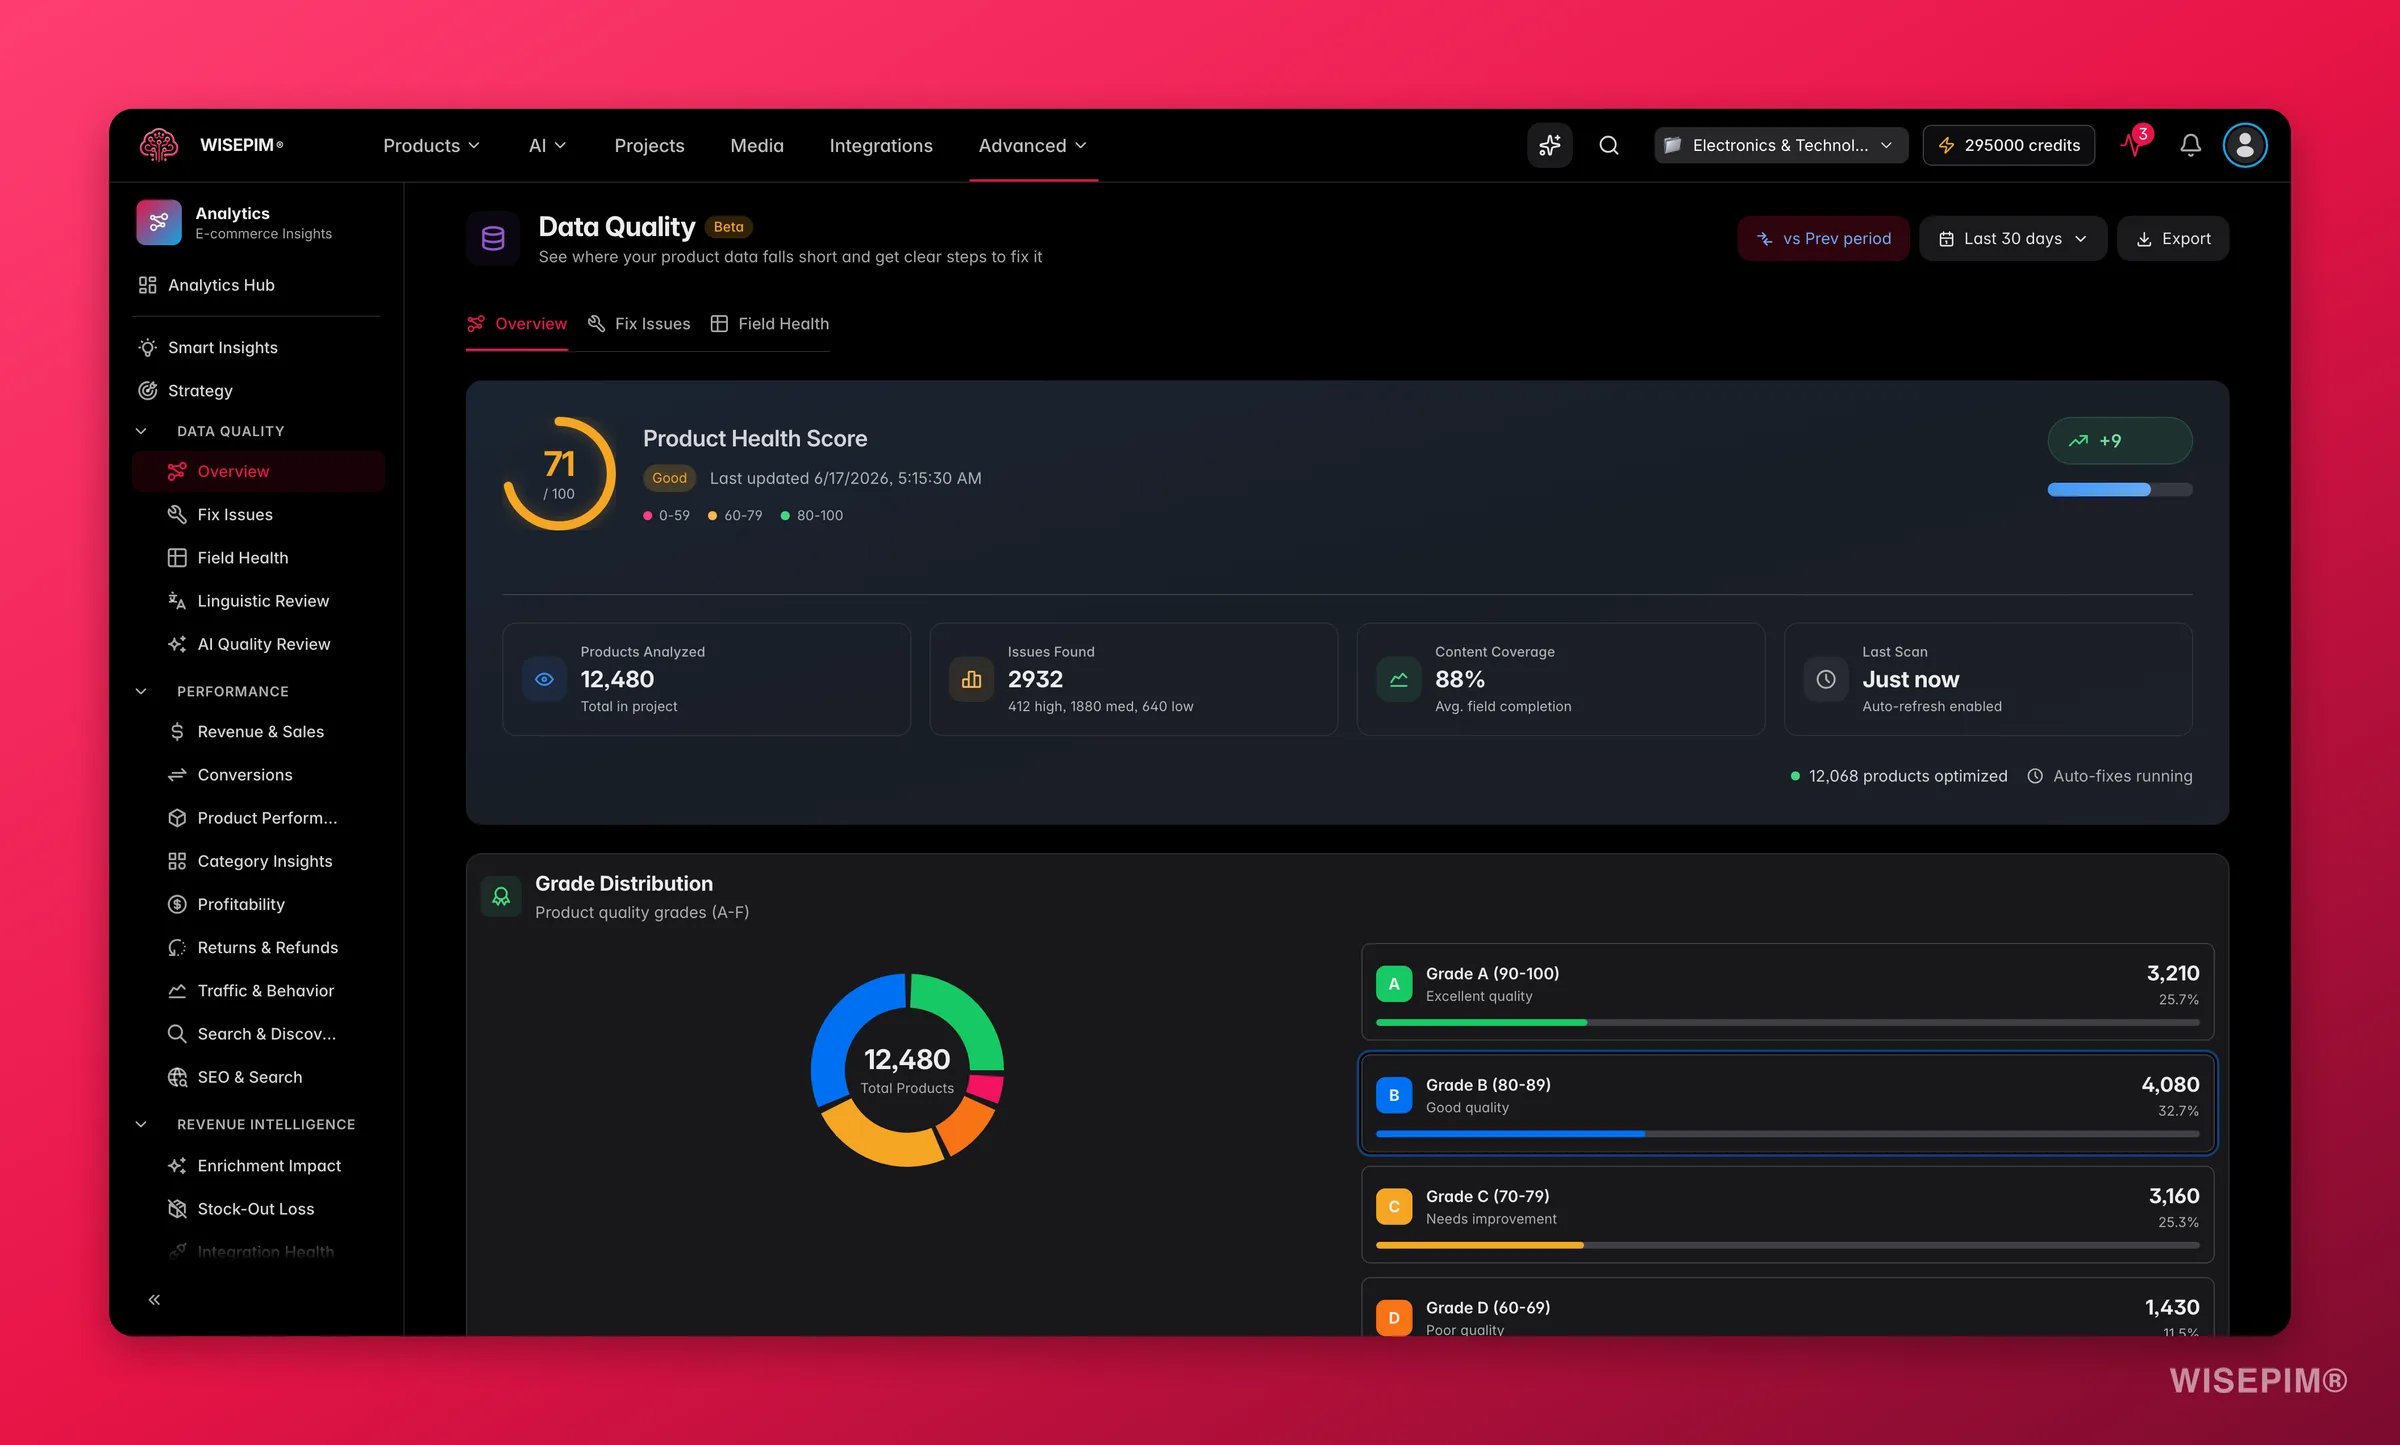 The Data Quality section measures how complete, accurate, and channel-ready your product data is. WISEPIM calculates a weighted quality score across four domains and gives you three focused sub-pages to understand the current state, fix issues, and drill into field-level health.
You need products imported into your project before quality metrics appear. If you see an empty state, [import your products](/en/essentials/importing-products) first.
## Three sub-pages
Switch between sub-pages using the tabs at the top of the section. Data loads once and is shared across all three tabs, so navigation is instant.
The main dashboard: your overall score, grade distribution, domain breakdown, trend charts, content coverage funnel, and action-impact history.
Issue-centric workspace: quick wins ranked by score impact, a filterable issues table, and the improvement roadmap.
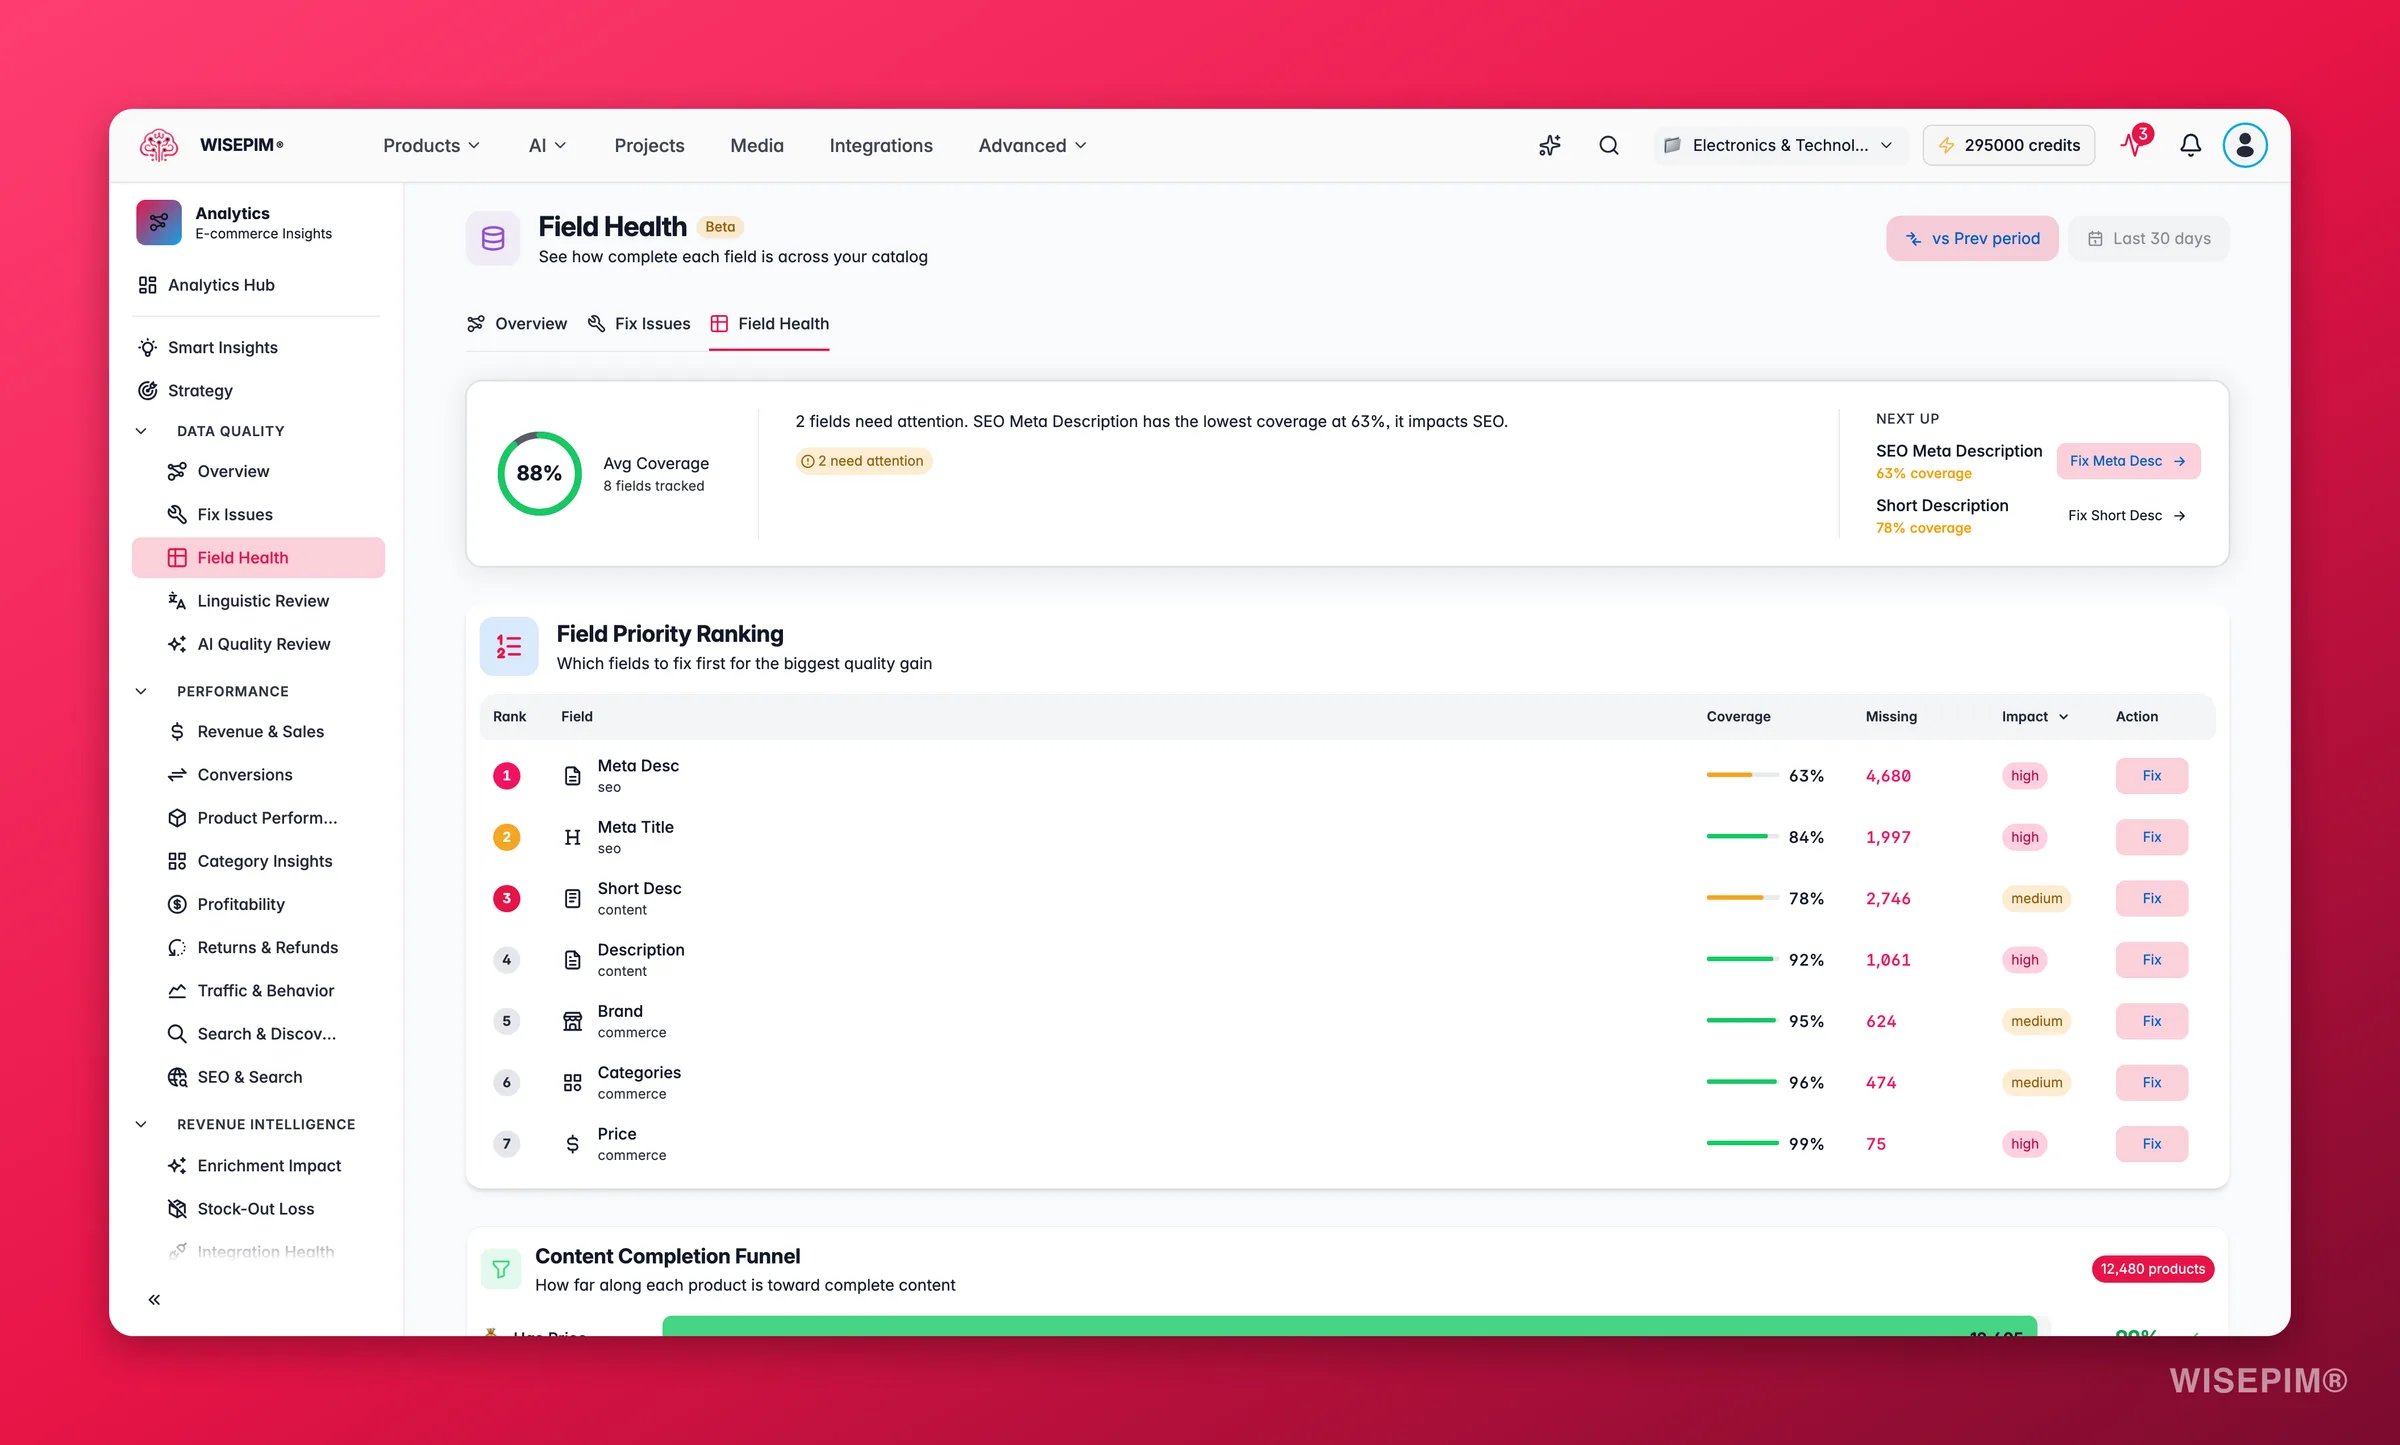
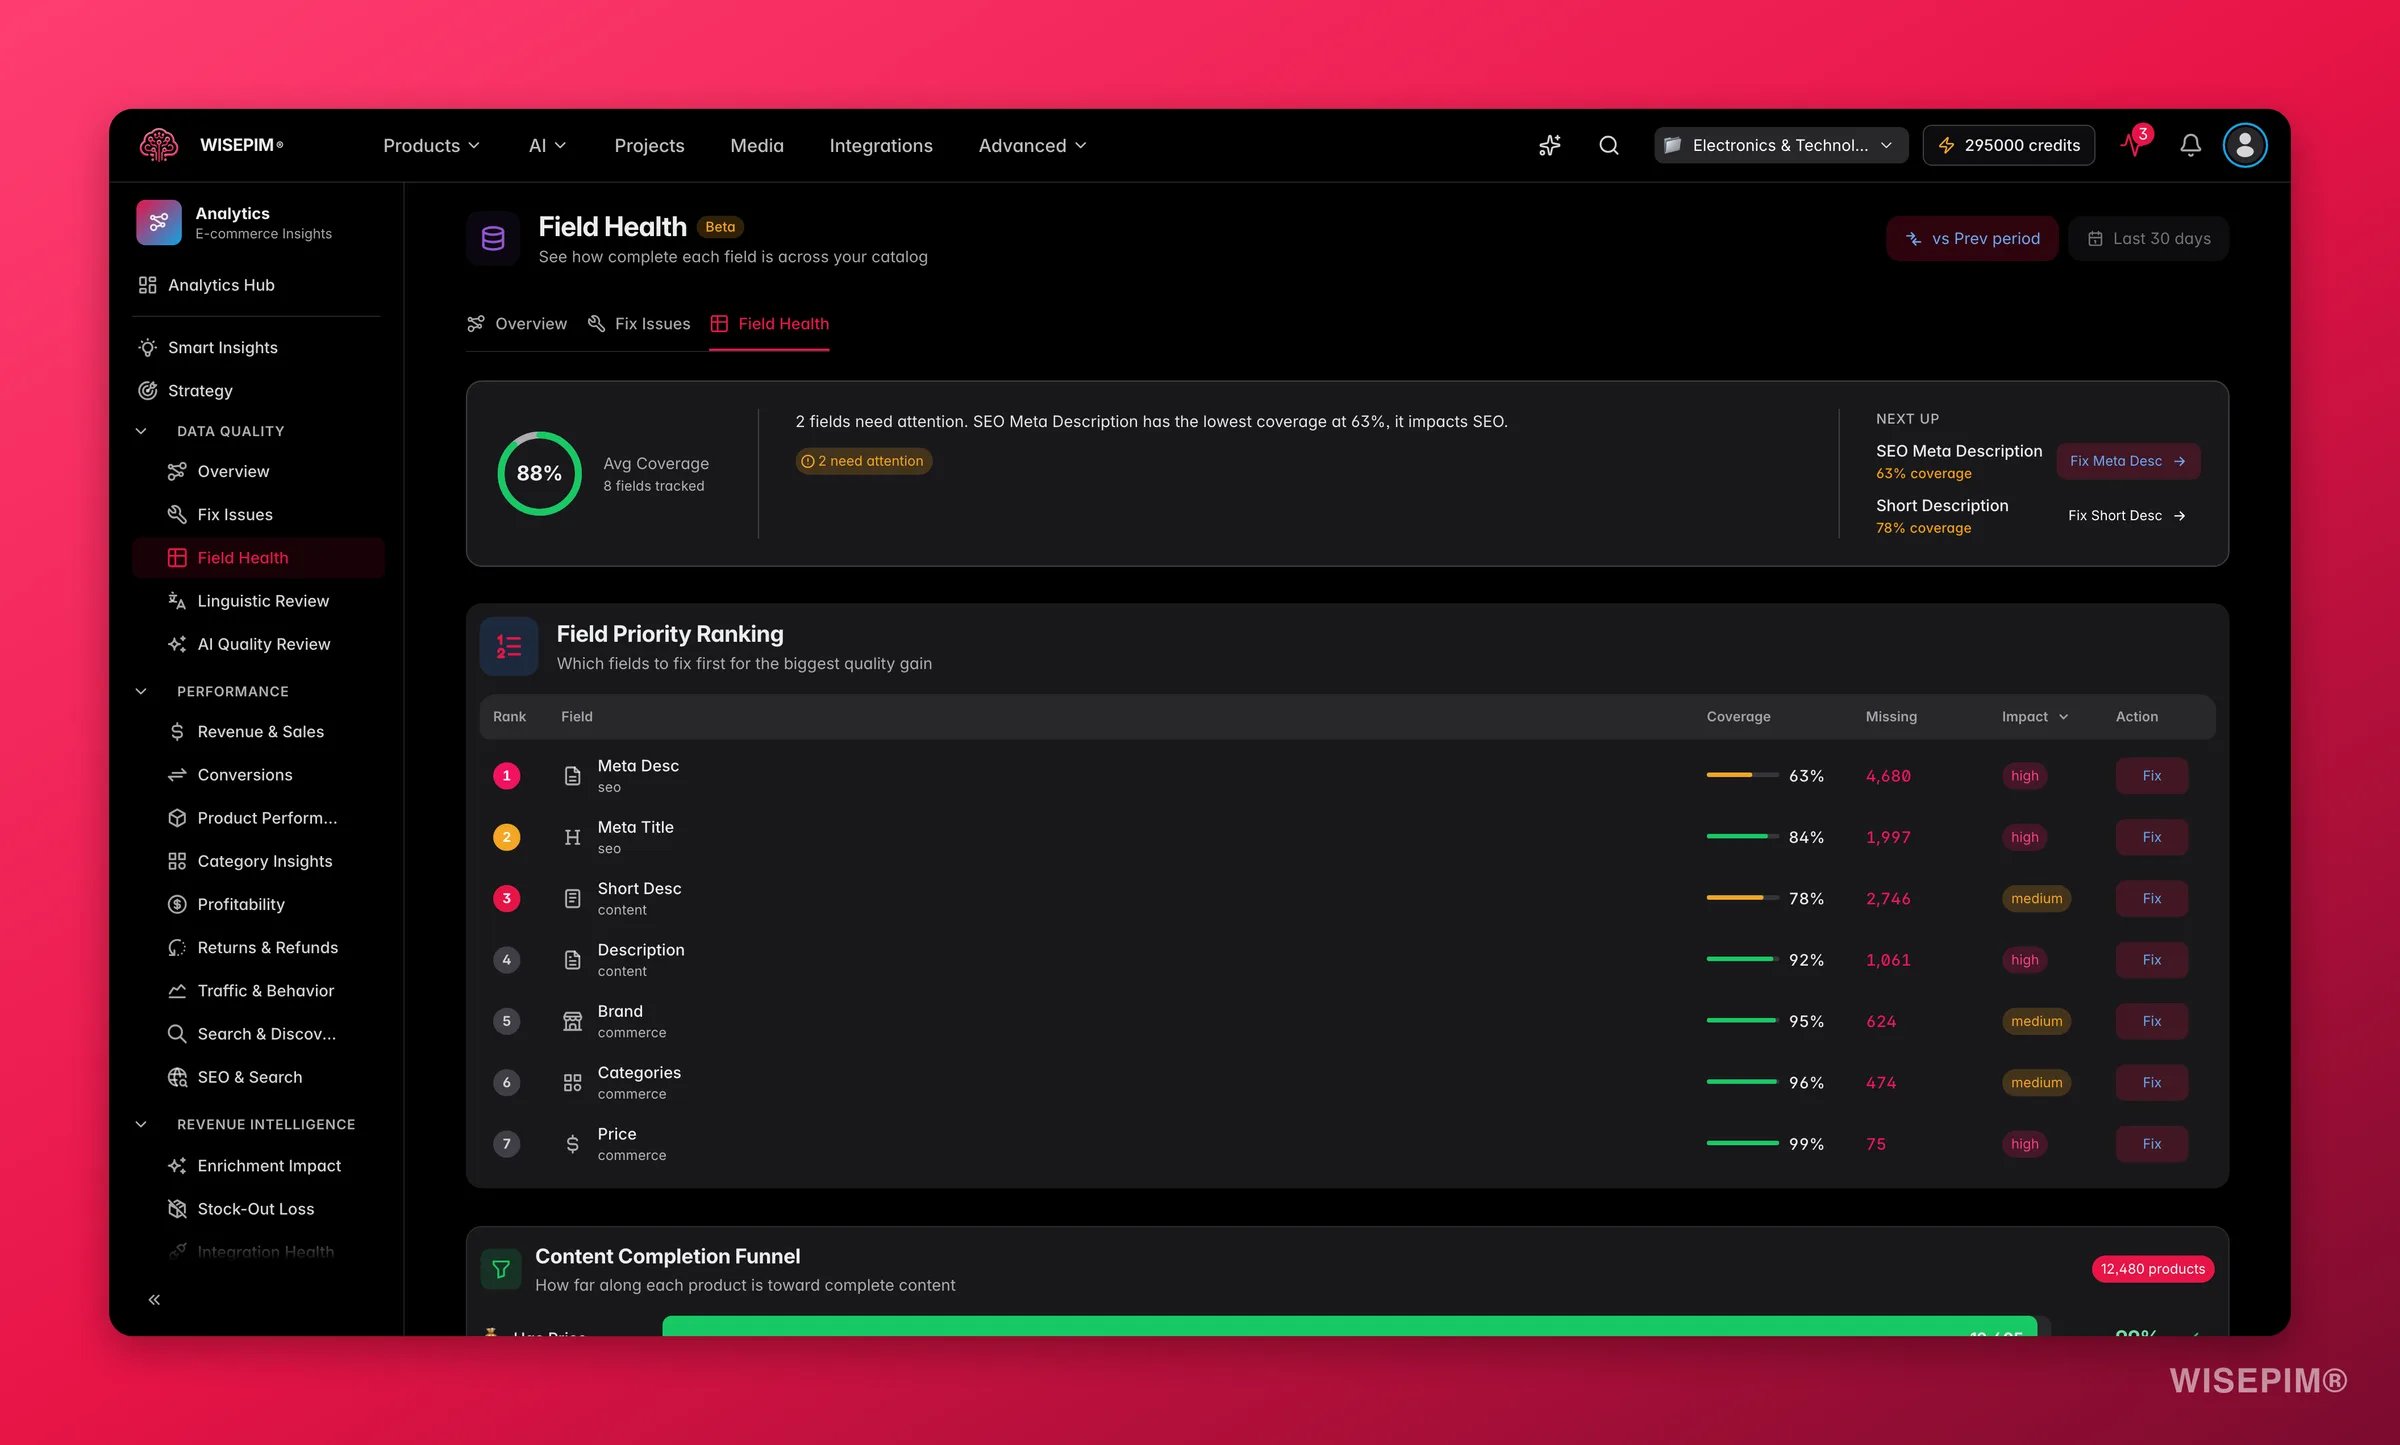
Field-level coverage matrix across product families, duplicate detection, catalog freshness, and schema suggestions.
## The quality score
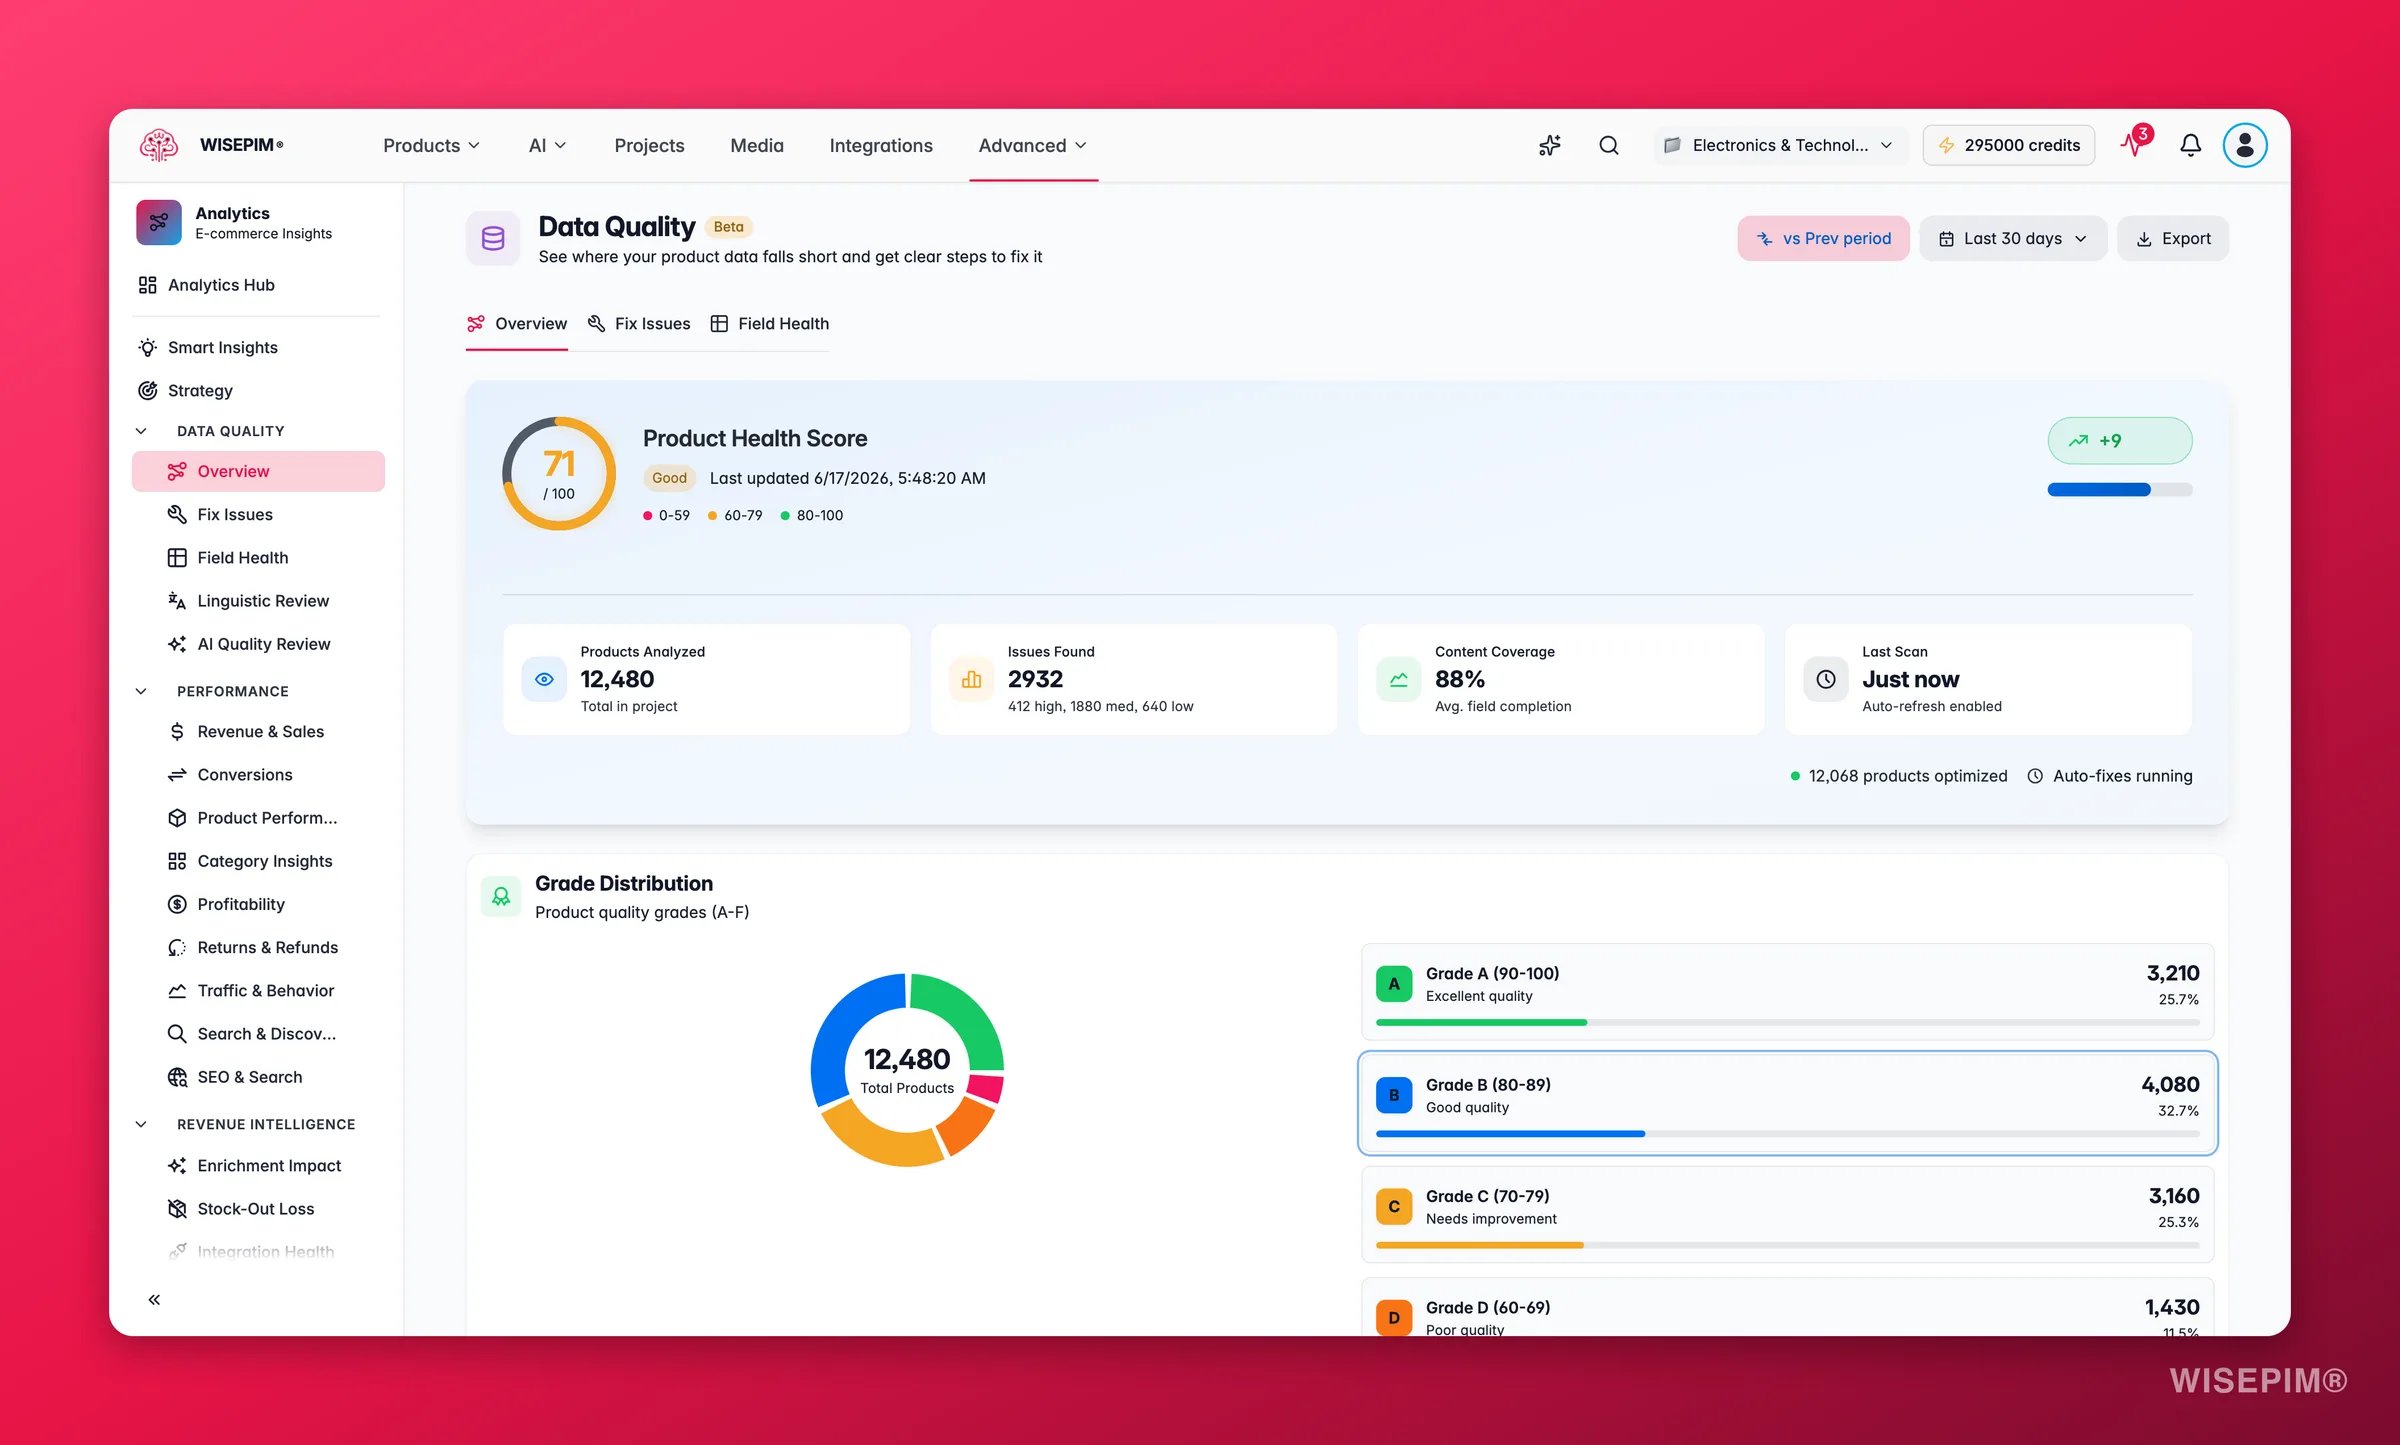
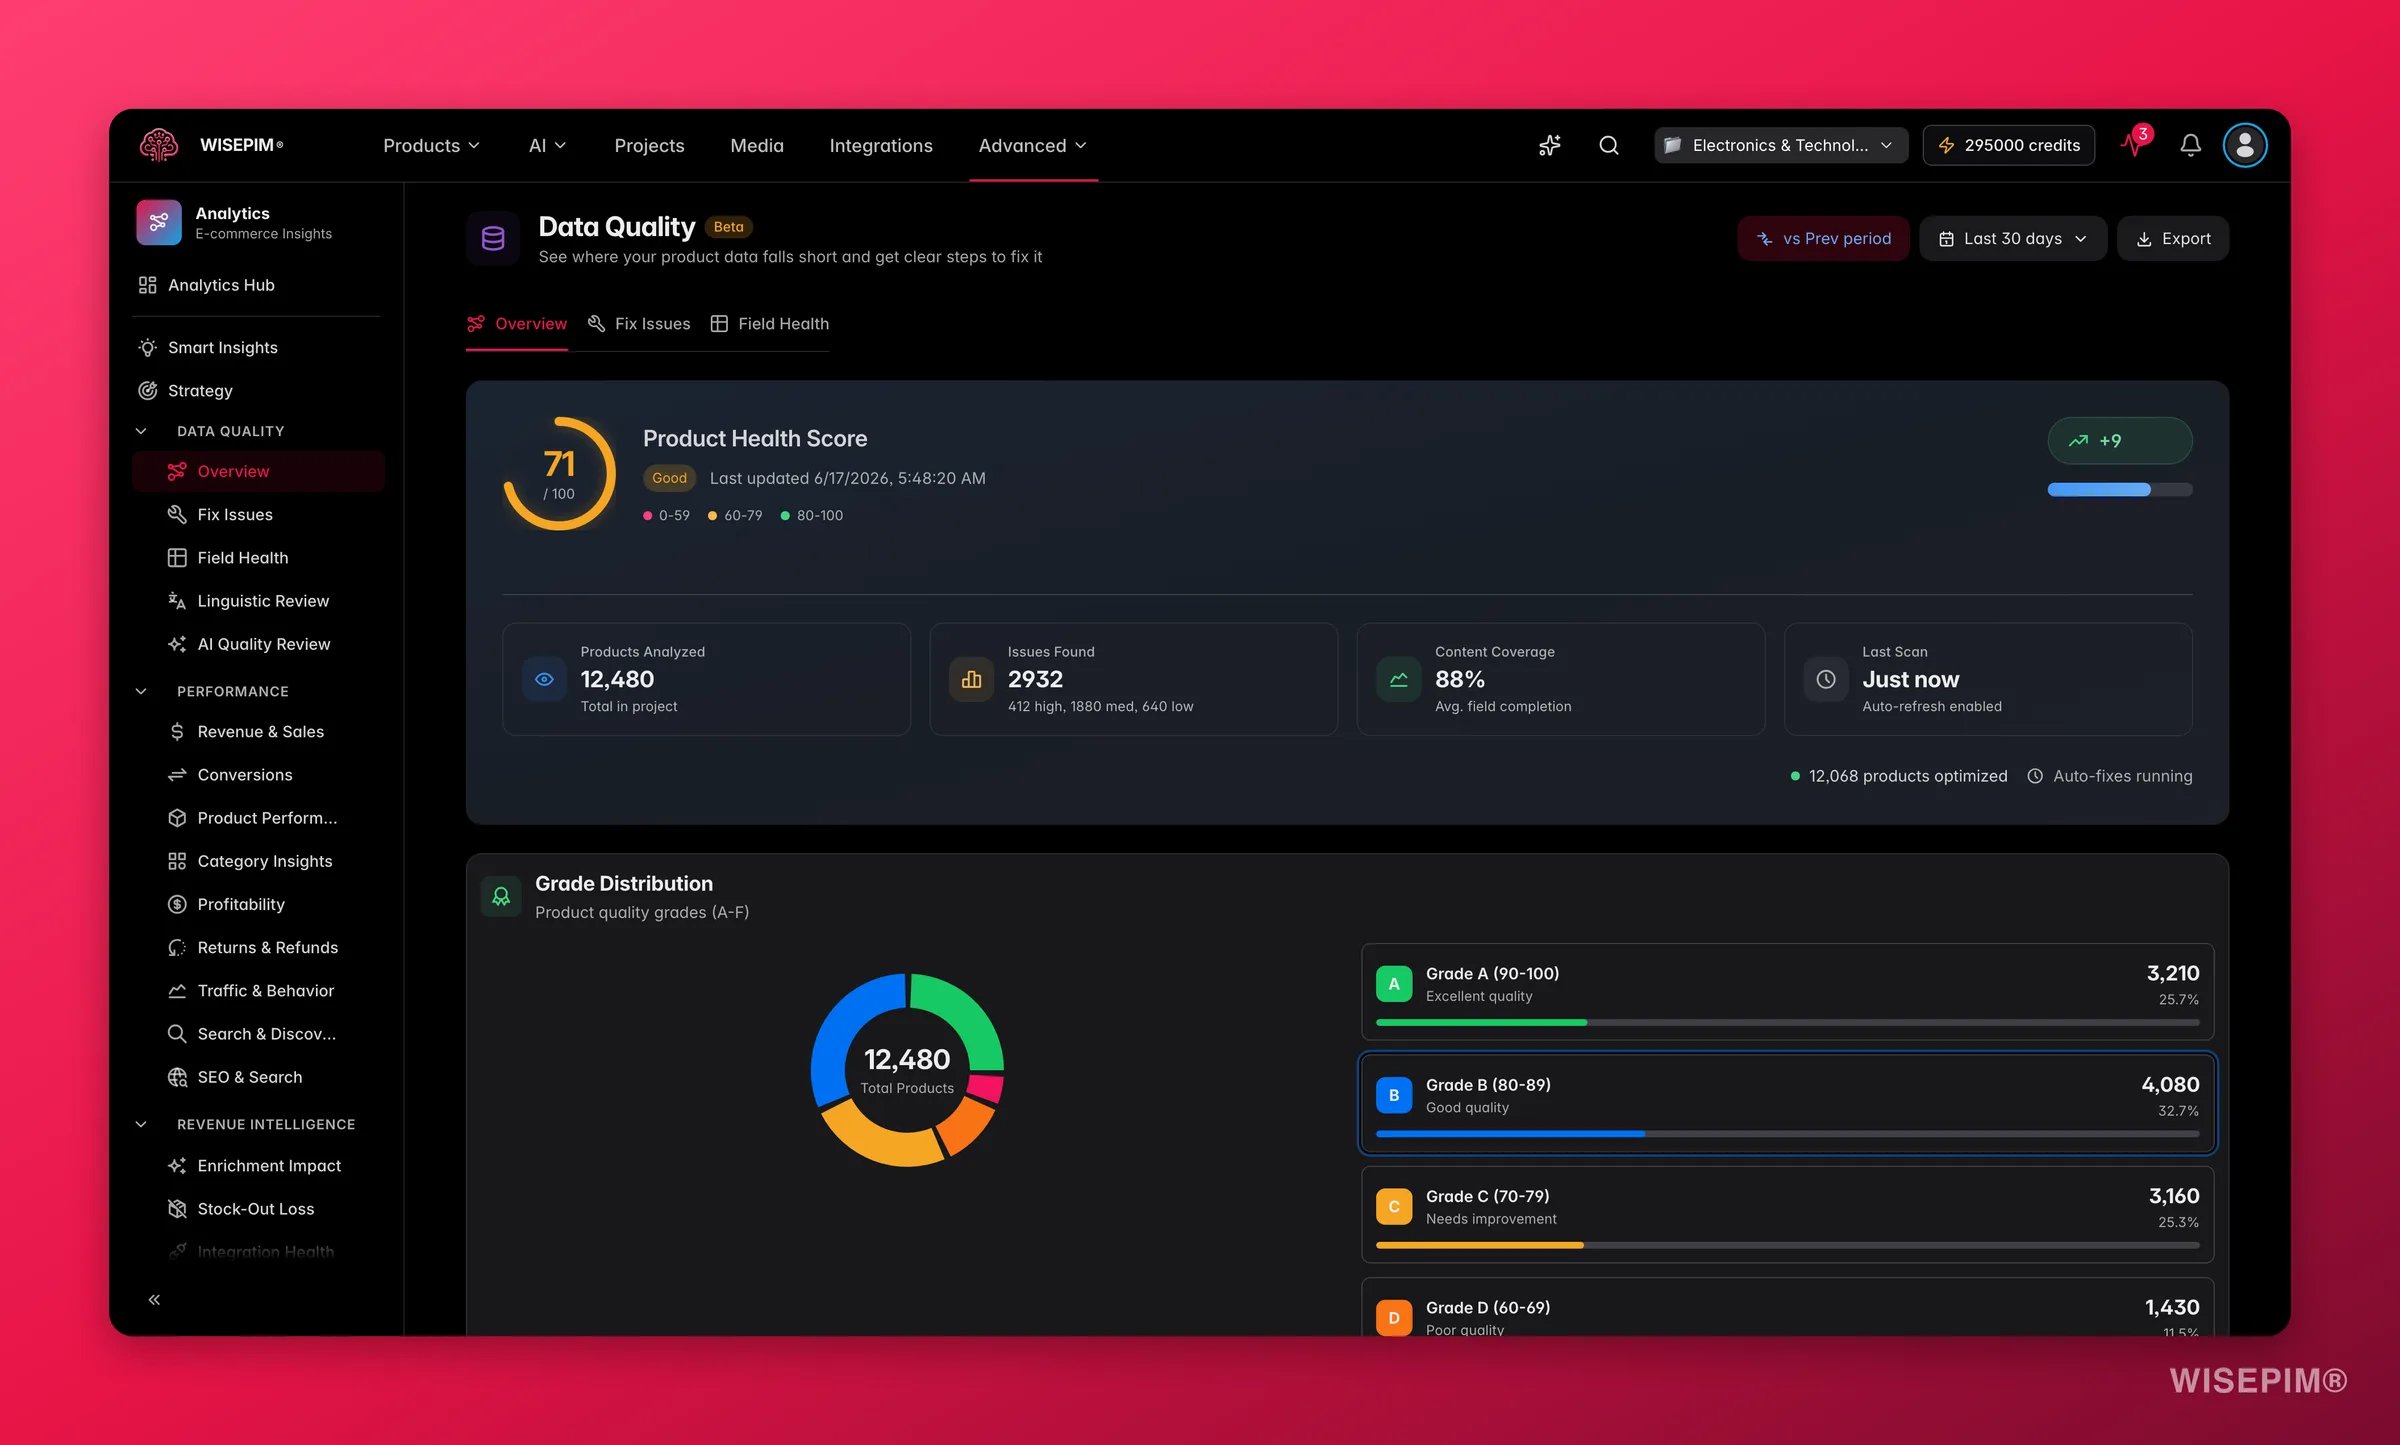
The hero metric at the top of the Overview shows your overall quality score on a 0–100 scale with a letter grade from A to F. It is a weighted average of four domain scores and updates automatically as you improve your data.
Alongside the score you can see:
* **Products needing attention**: products with high-priority issues
* **Issue breakdown**: counts by severity (high, medium, low)
* **Content coverage**: average percentage of key fields filled across your catalog
* **Score trend**: direction and size of change versus the previous period
### What a healthy score looks like
These are the default grade thresholds. They are configurable in [project settings](/en/settings/data-quality) to match your team's standards.
| Score | Grade | What it means |
| -------- | ----- | ------------------------------------------------------------------------------- |
| 90–100 | A | Excellent, data is optimized for visibility and conversion across all channels |
| 80–89 | B | Good, minor improvements available, but the catalog is channel-ready |
| 70–79 | C | Needs work, gaps in SEO or conversion fields are likely suppressing performance |
| 60–69 | D | Poor, missing required fields are blocking channel listings or harming rankings |
| Below 60 | F | Critical, core fields are absent; enrichment is urgent |
**Aim for a B (80+) as your baseline.** Stores that maintain a B-or-above score consistently see lower return rates (fewer "not as described" issues) and better channel listing acceptance. An A (90+) is the target for high-competition categories where ranking differences are determined by content quality.
You can customize grade thresholds and domain weights in your [project settings](/en/settings/data-quality) to match your team's standards.
## Domain score breakdown
Your score is built from four domains:
How thoroughly your core fields are filled in: titles, descriptions, images, prices, categories, and brand.
Whether your products meet the data requirements of each connected sales channel (Shopify, Magento, WooCommerce, and others).
Meta titles, meta descriptions, and keyword optimization, so your products appear in search results.
Whether your data includes the elements that drive purchases: rich descriptions, multiple images, and compelling content.
Each domain score appears in a radar chart (shape comparison at a glance) and a bar breakdown (pinpoint which domain to prioritize).
**Reading the domain breakdown:**
* A **well-balanced radar shape** (all four domains roughly equal) indicates systematic quality work. A lopsided shape means one domain is the bottleneck, fixing it will raise the overall score faster than spreading effort evenly.
* **Completeness and Channel Readiness below 70** are the most urgent: they directly cause import failures and listing rejections on sales channels.
* **SEO below 70** suppresses organic traffic without an obvious "broken" symptom, products list fine but rank poorly.
* **Conversion Potential below 70** means your listings are technically complete but not optimized to close the sale.
The Data Quality section measures how complete, accurate, and channel-ready your product data is. WISEPIM calculates a weighted quality score across four domains and gives you three focused sub-pages to understand the current state, fix issues, and drill into field-level health.
You need products imported into your project before quality metrics appear. If you see an empty state, [import your products](/en/essentials/importing-products) first.
## Three sub-pages
Switch between sub-pages using the tabs at the top of the section. Data loads once and is shared across all three tabs, so navigation is instant.
The main dashboard: your overall score, grade distribution, domain breakdown, trend charts, content coverage funnel, and action-impact history.
Issue-centric workspace: quick wins ranked by score impact, a filterable issues table, and the improvement roadmap.
Field-level coverage matrix across product families, duplicate detection, catalog freshness, and schema suggestions.
## The quality score
The hero metric at the top of the Overview shows your overall quality score on a 0–100 scale with a letter grade from A to F. It is a weighted average of four domain scores and updates automatically as you improve your data.
Alongside the score you can see:
* **Products needing attention**: products with high-priority issues
* **Issue breakdown**: counts by severity (high, medium, low)
* **Content coverage**: average percentage of key fields filled across your catalog
* **Score trend**: direction and size of change versus the previous period
### What a healthy score looks like
These are the default grade thresholds. They are configurable in [project settings](/en/settings/data-quality) to match your team's standards.
| Score | Grade | What it means |
| -------- | ----- | ------------------------------------------------------------------------------- |
| 90–100 | A | Excellent, data is optimized for visibility and conversion across all channels |
| 80–89 | B | Good, minor improvements available, but the catalog is channel-ready |
| 70–79 | C | Needs work, gaps in SEO or conversion fields are likely suppressing performance |
| 60–69 | D | Poor, missing required fields are blocking channel listings or harming rankings |
| Below 60 | F | Critical, core fields are absent; enrichment is urgent |
**Aim for a B (80+) as your baseline.** Stores that maintain a B-or-above score consistently see lower return rates (fewer "not as described" issues) and better channel listing acceptance. An A (90+) is the target for high-competition categories where ranking differences are determined by content quality.
You can customize grade thresholds and domain weights in your [project settings](/en/settings/data-quality) to match your team's standards.
## Domain score breakdown
Your score is built from four domains:
How thoroughly your core fields are filled in: titles, descriptions, images, prices, categories, and brand.
Whether your products meet the data requirements of each connected sales channel (Shopify, Magento, WooCommerce, and others).
Meta titles, meta descriptions, and keyword optimization, so your products appear in search results.
Whether your data includes the elements that drive purchases: rich descriptions, multiple images, and compelling content.
Each domain score appears in a radar chart (shape comparison at a glance) and a bar breakdown (pinpoint which domain to prioritize).
**Reading the domain breakdown:**
* A **well-balanced radar shape** (all four domains roughly equal) indicates systematic quality work. A lopsided shape means one domain is the bottleneck, fixing it will raise the overall score faster than spreading effort evenly.
* **Completeness and Channel Readiness below 70** are the most urgent: they directly cause import failures and listing rejections on sales channels.
* **SEO below 70** suppresses organic traffic without an obvious "broken" symptom, products list fine but rank poorly.
* **Conversion Potential below 70** means your listings are technically complete but not optimized to close the sale.
 ## Overview charts
### Grade distribution
How your products spread across quality grades (A+ to F). Use this to see how many products are in excellent shape versus how many need work.
### Domain trend comparison
How each of the four domain scores has moved over time. See whether completeness is improving while SEO stays flat, and prioritize accordingly.
### Historical score chart
Your overall quality score trend across the selected date range (7 days, 30 days, 90 days, or 12 months).
### Content coverage funnel
The percentage of products that have each key field filled in: descriptions, short descriptions, meta titles, meta descriptions, categories, images, brand, and price. This funnel view shows where the biggest gaps are.
## Overview charts
### Grade distribution
How your products spread across quality grades (A+ to F). Use this to see how many products are in excellent shape versus how many need work.
### Domain trend comparison
How each of the four domain scores has moved over time. See whether completeness is improving while SEO stays flat, and prioritize accordingly.
### Historical score chart
Your overall quality score trend across the selected date range (7 days, 30 days, 90 days, or 12 months).
### Content coverage funnel
The percentage of products that have each key field filled in: descriptions, short descriptions, meta titles, meta descriptions, categories, images, brand, and price. This funnel view shows where the biggest gaps are.
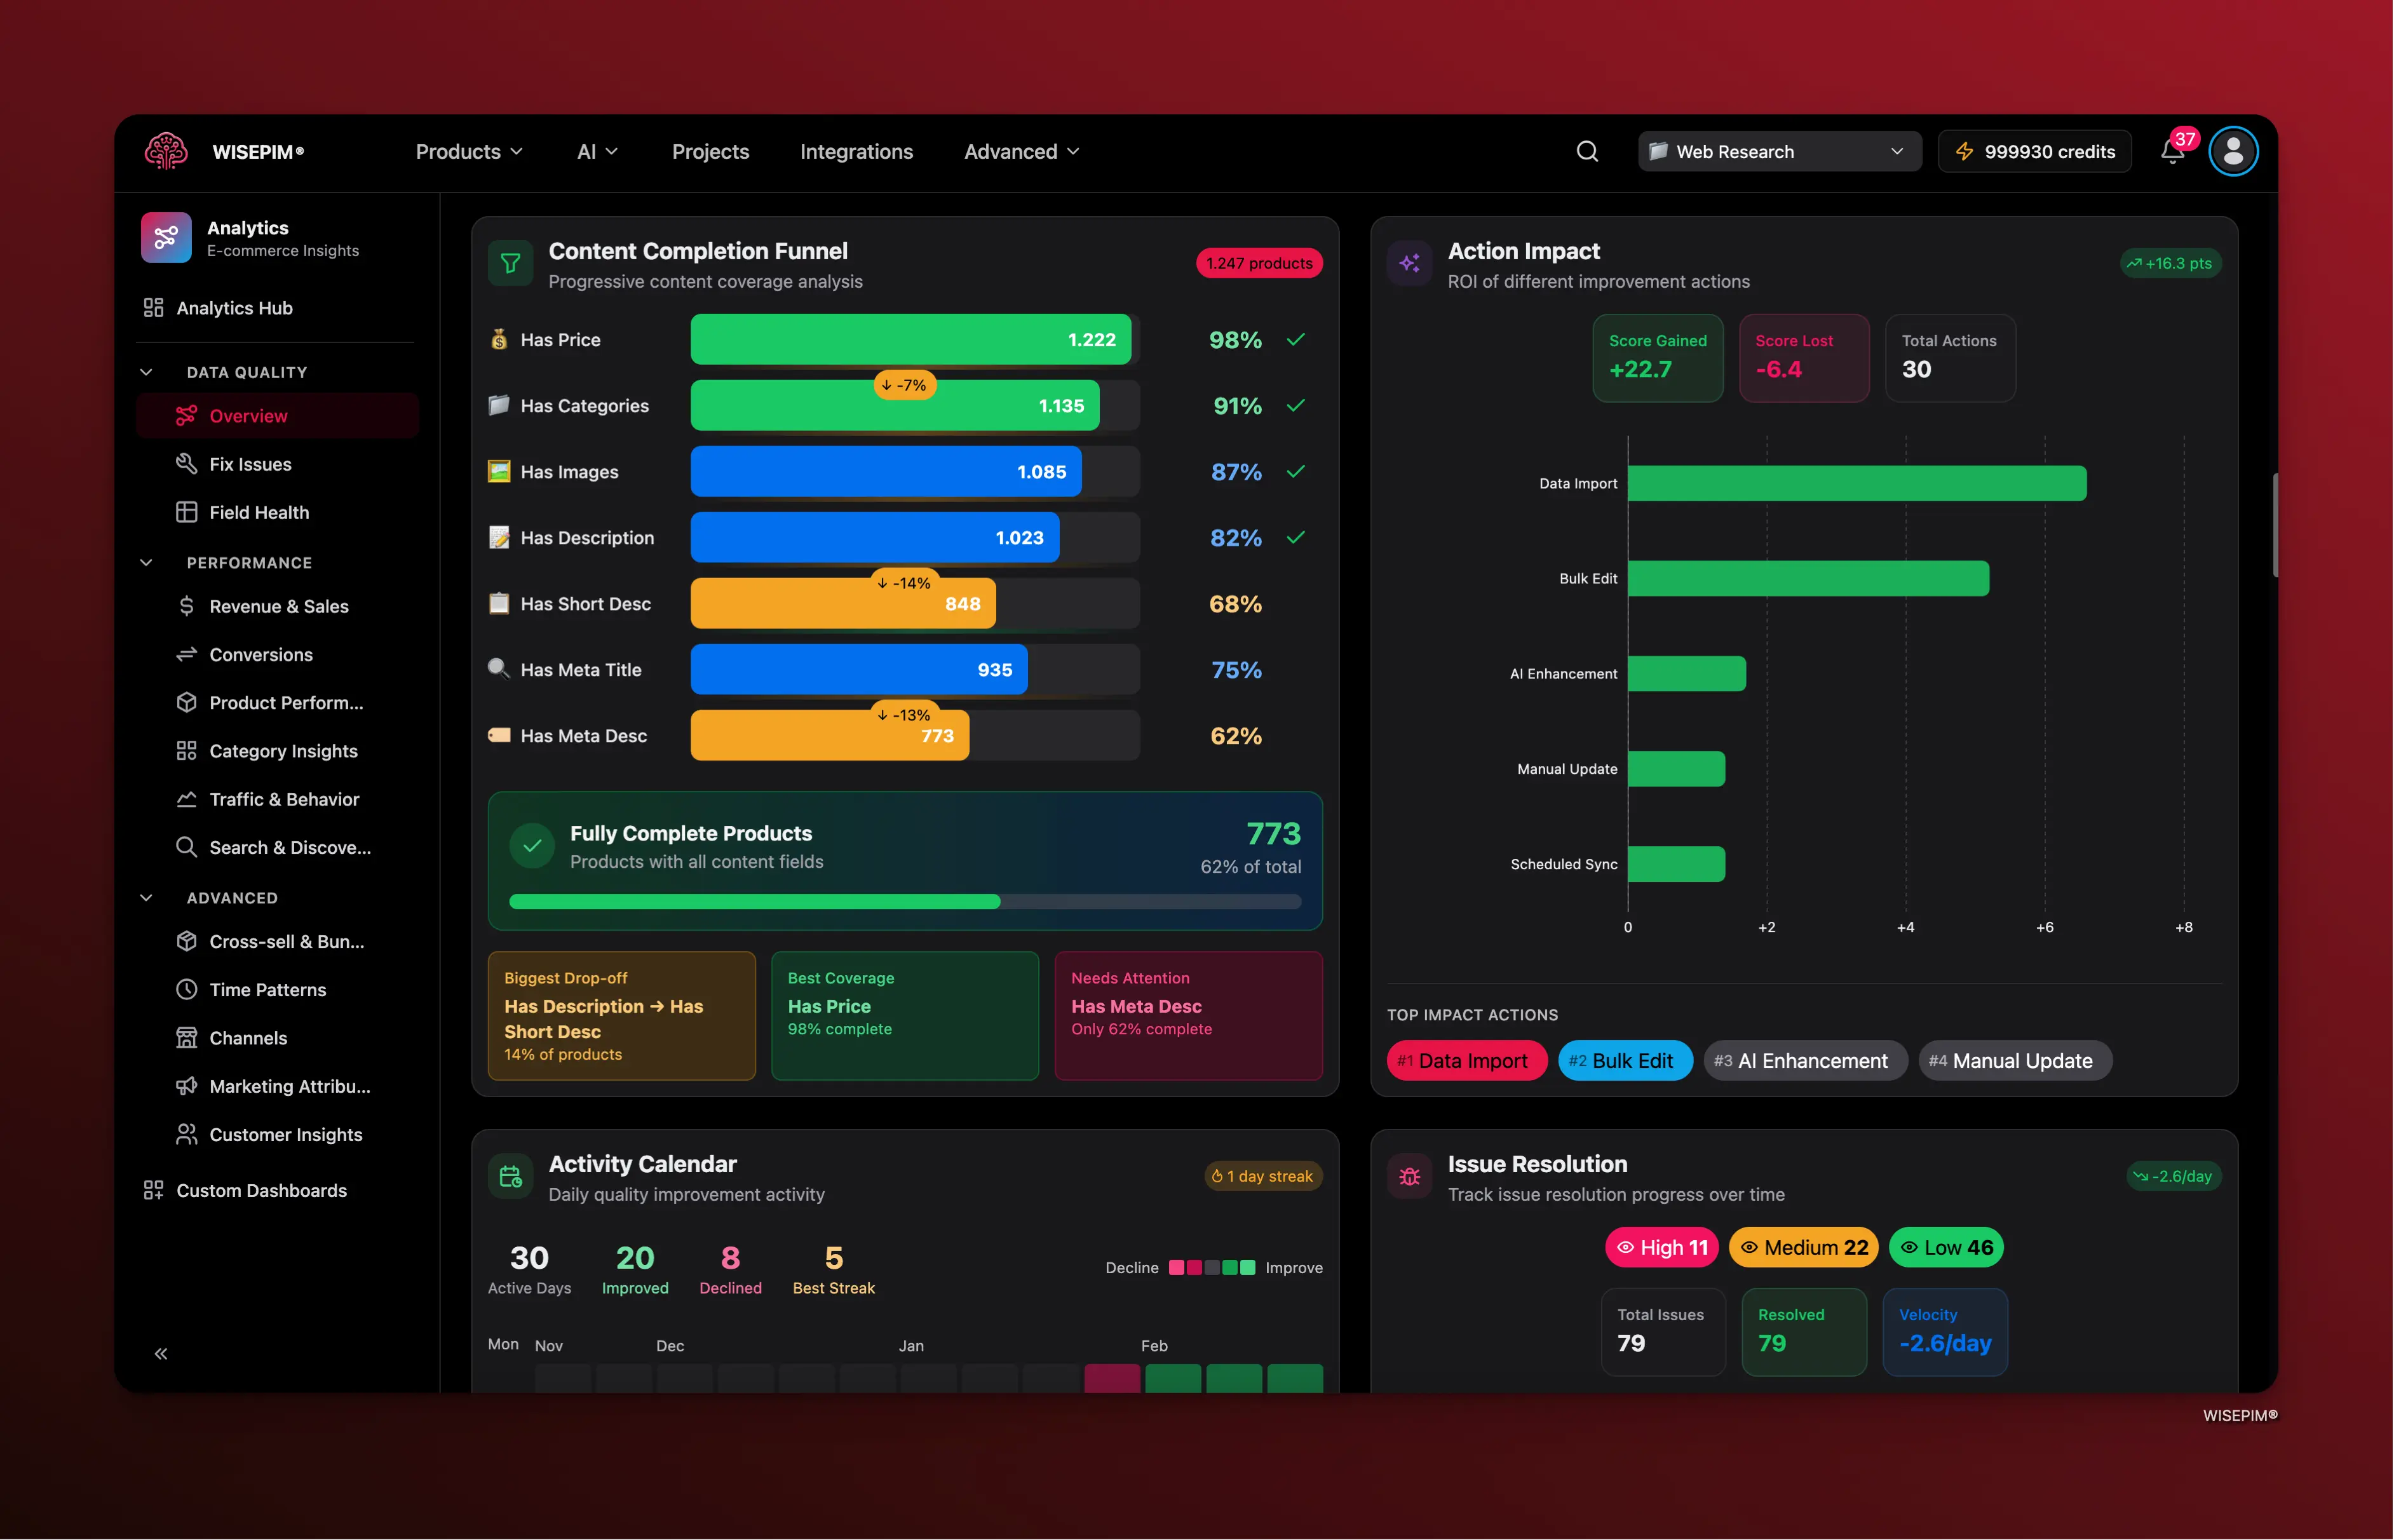 If your score drops sharply, check the **Action Impact** chart. It shows whether the drop came from a bulk import, manual edits, or automated updates, so you can find the root cause fast.
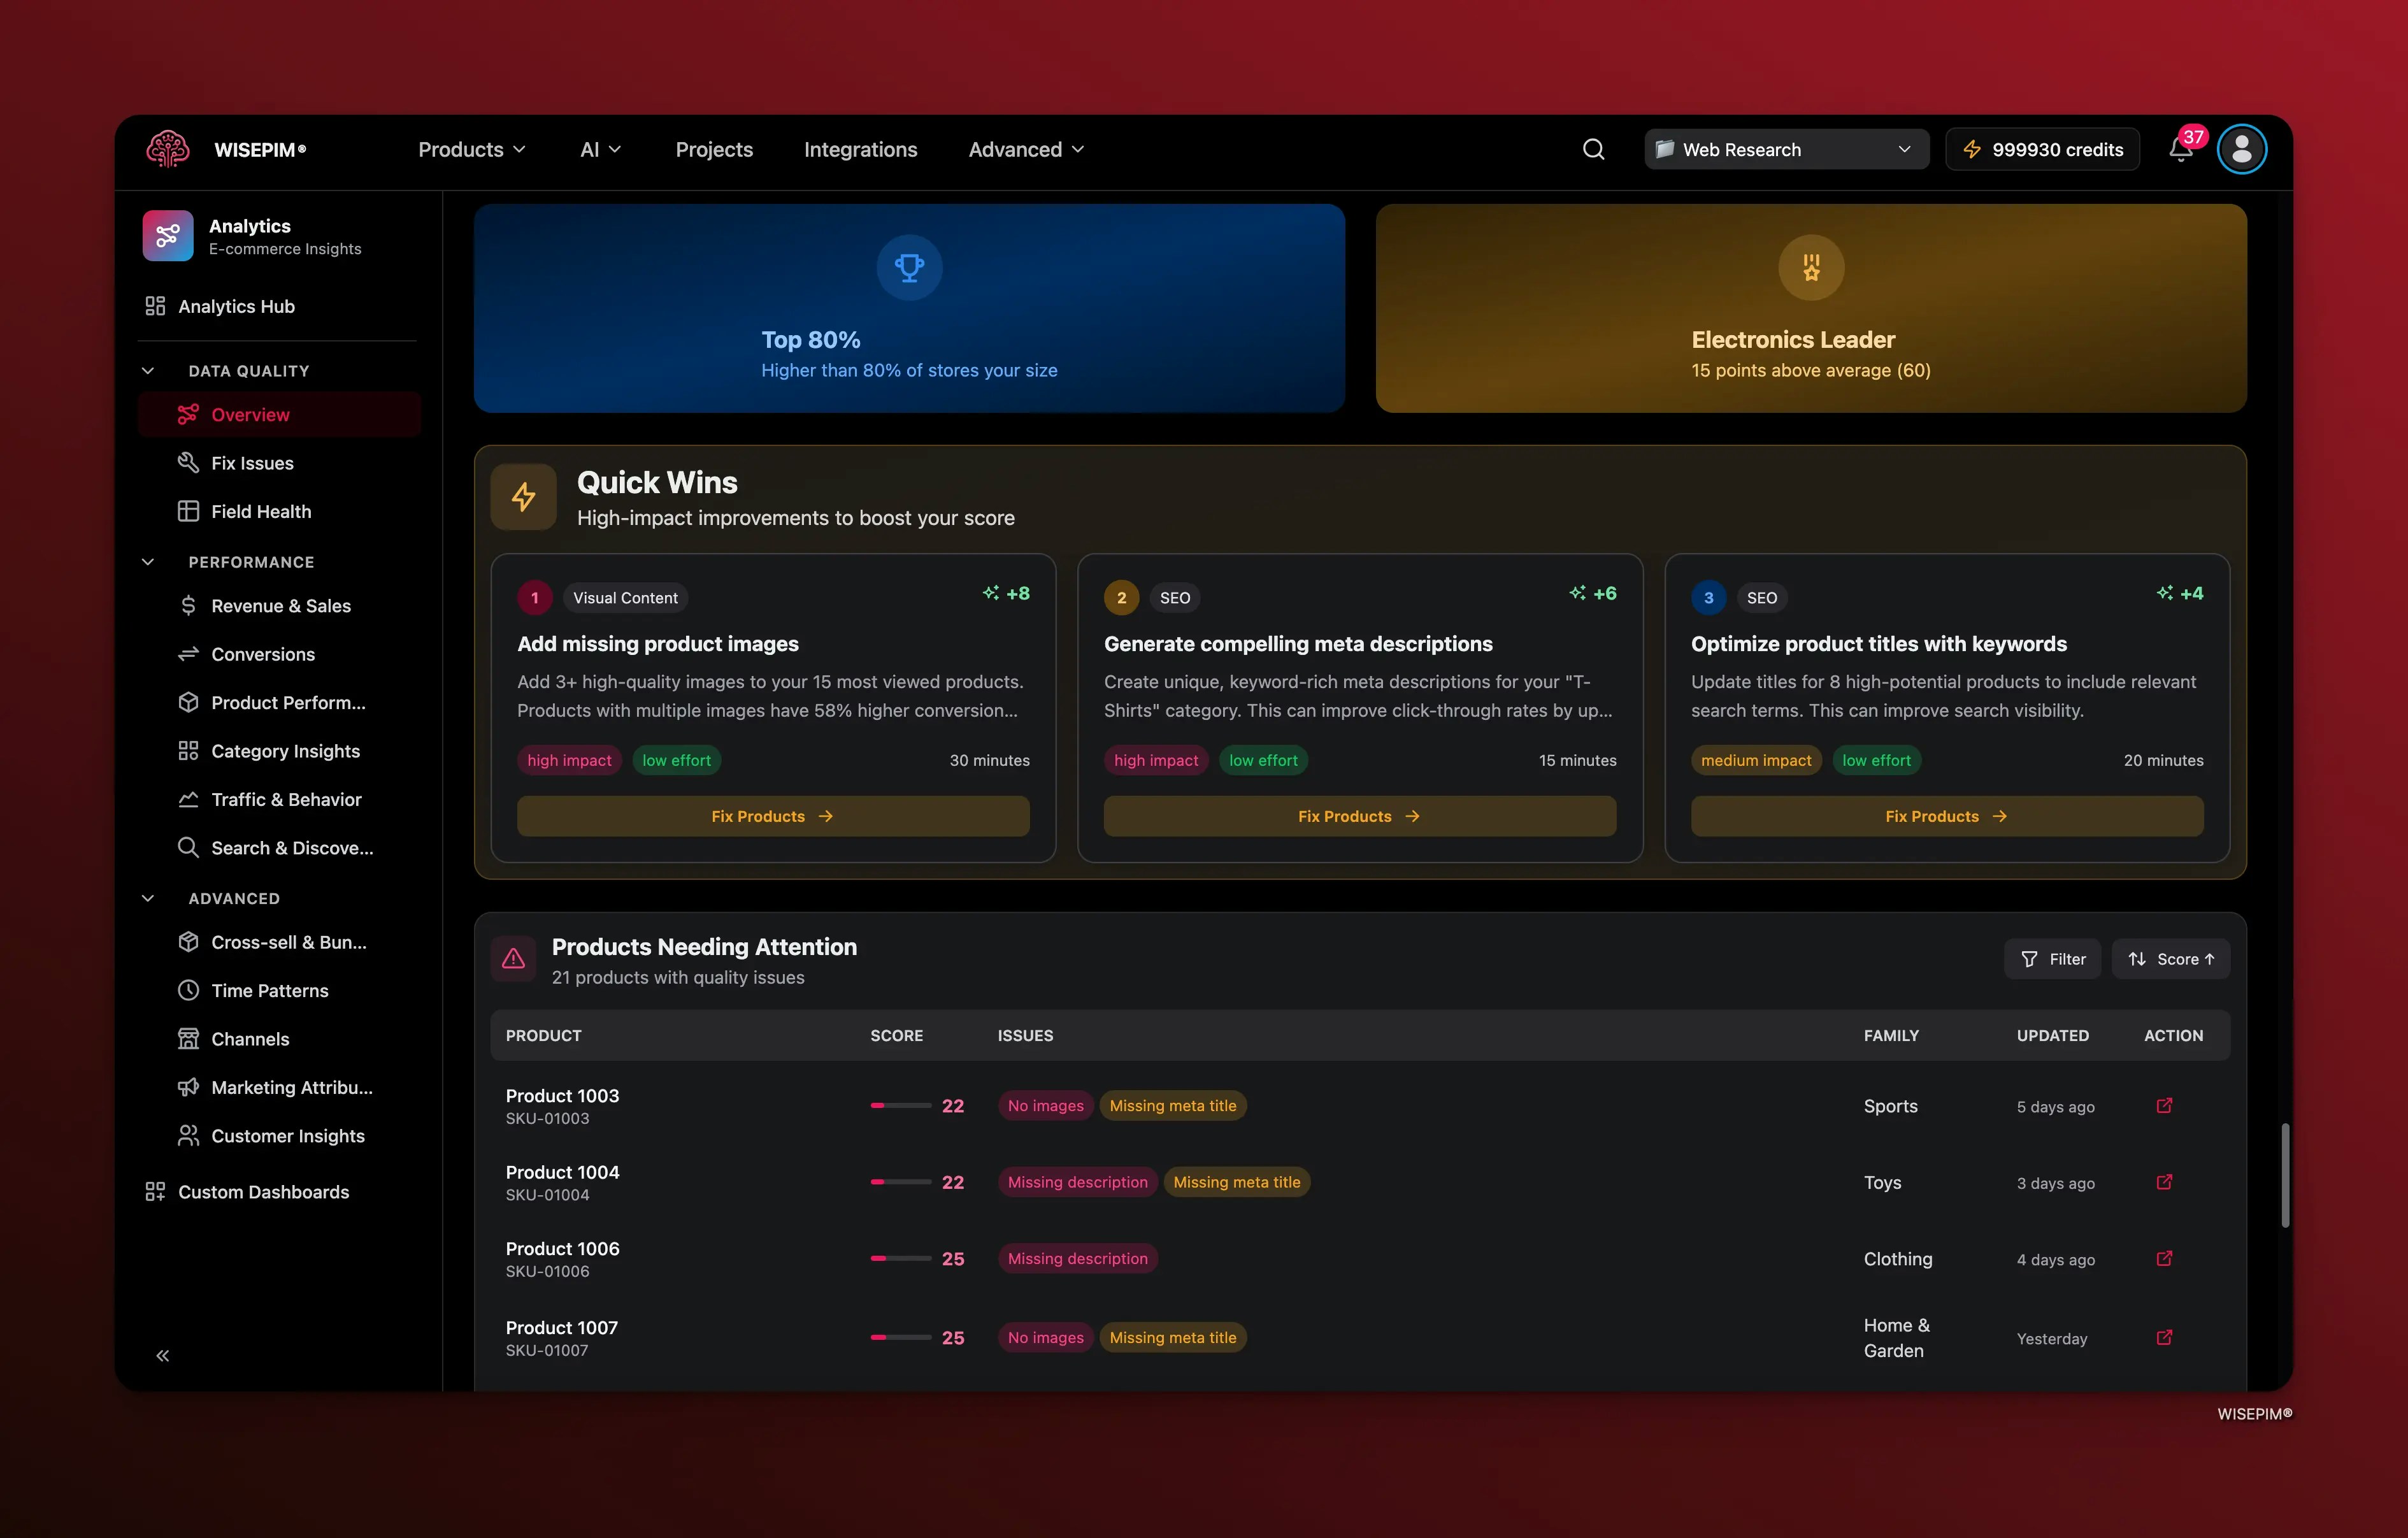 ## Fix Issues sub-page
The Fix Issues tab is where you go to act. It surfaces what to fix first and lets you navigate directly to the products that need work.
### Quick Wins
## Fix Issues sub-page
The Fix Issues tab is where you go to act. It surfaces what to fix first and lets you navigate directly to the products that need work.
### Quick Wins
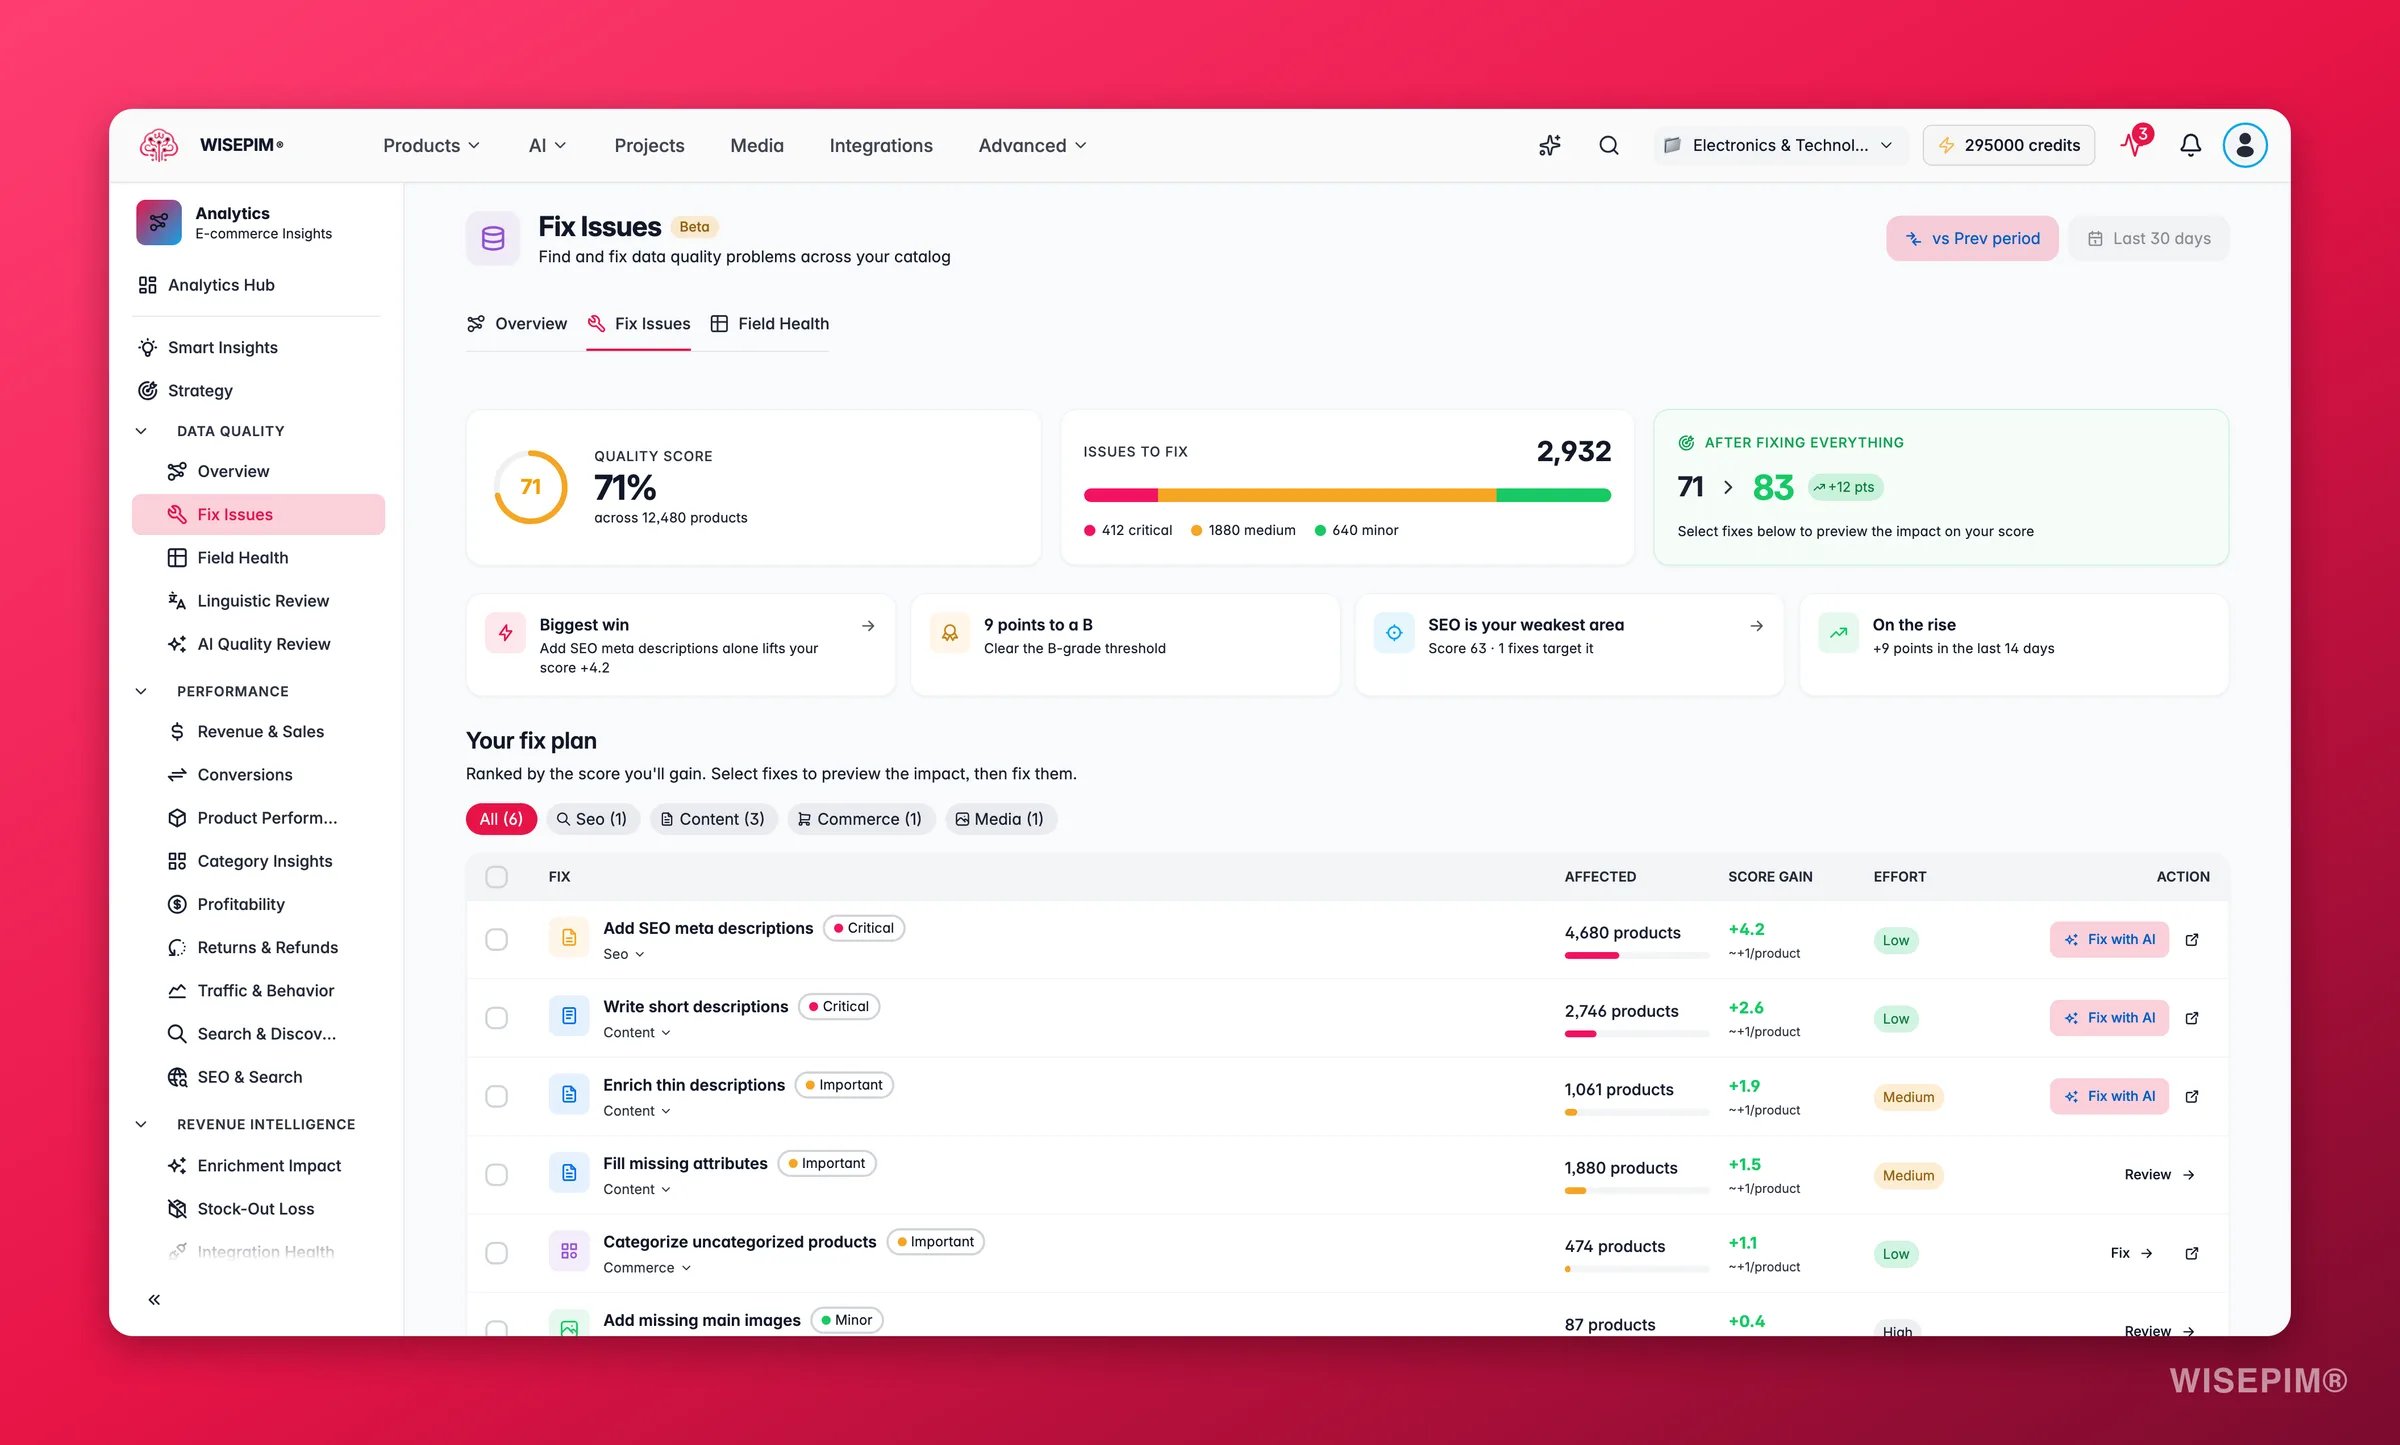
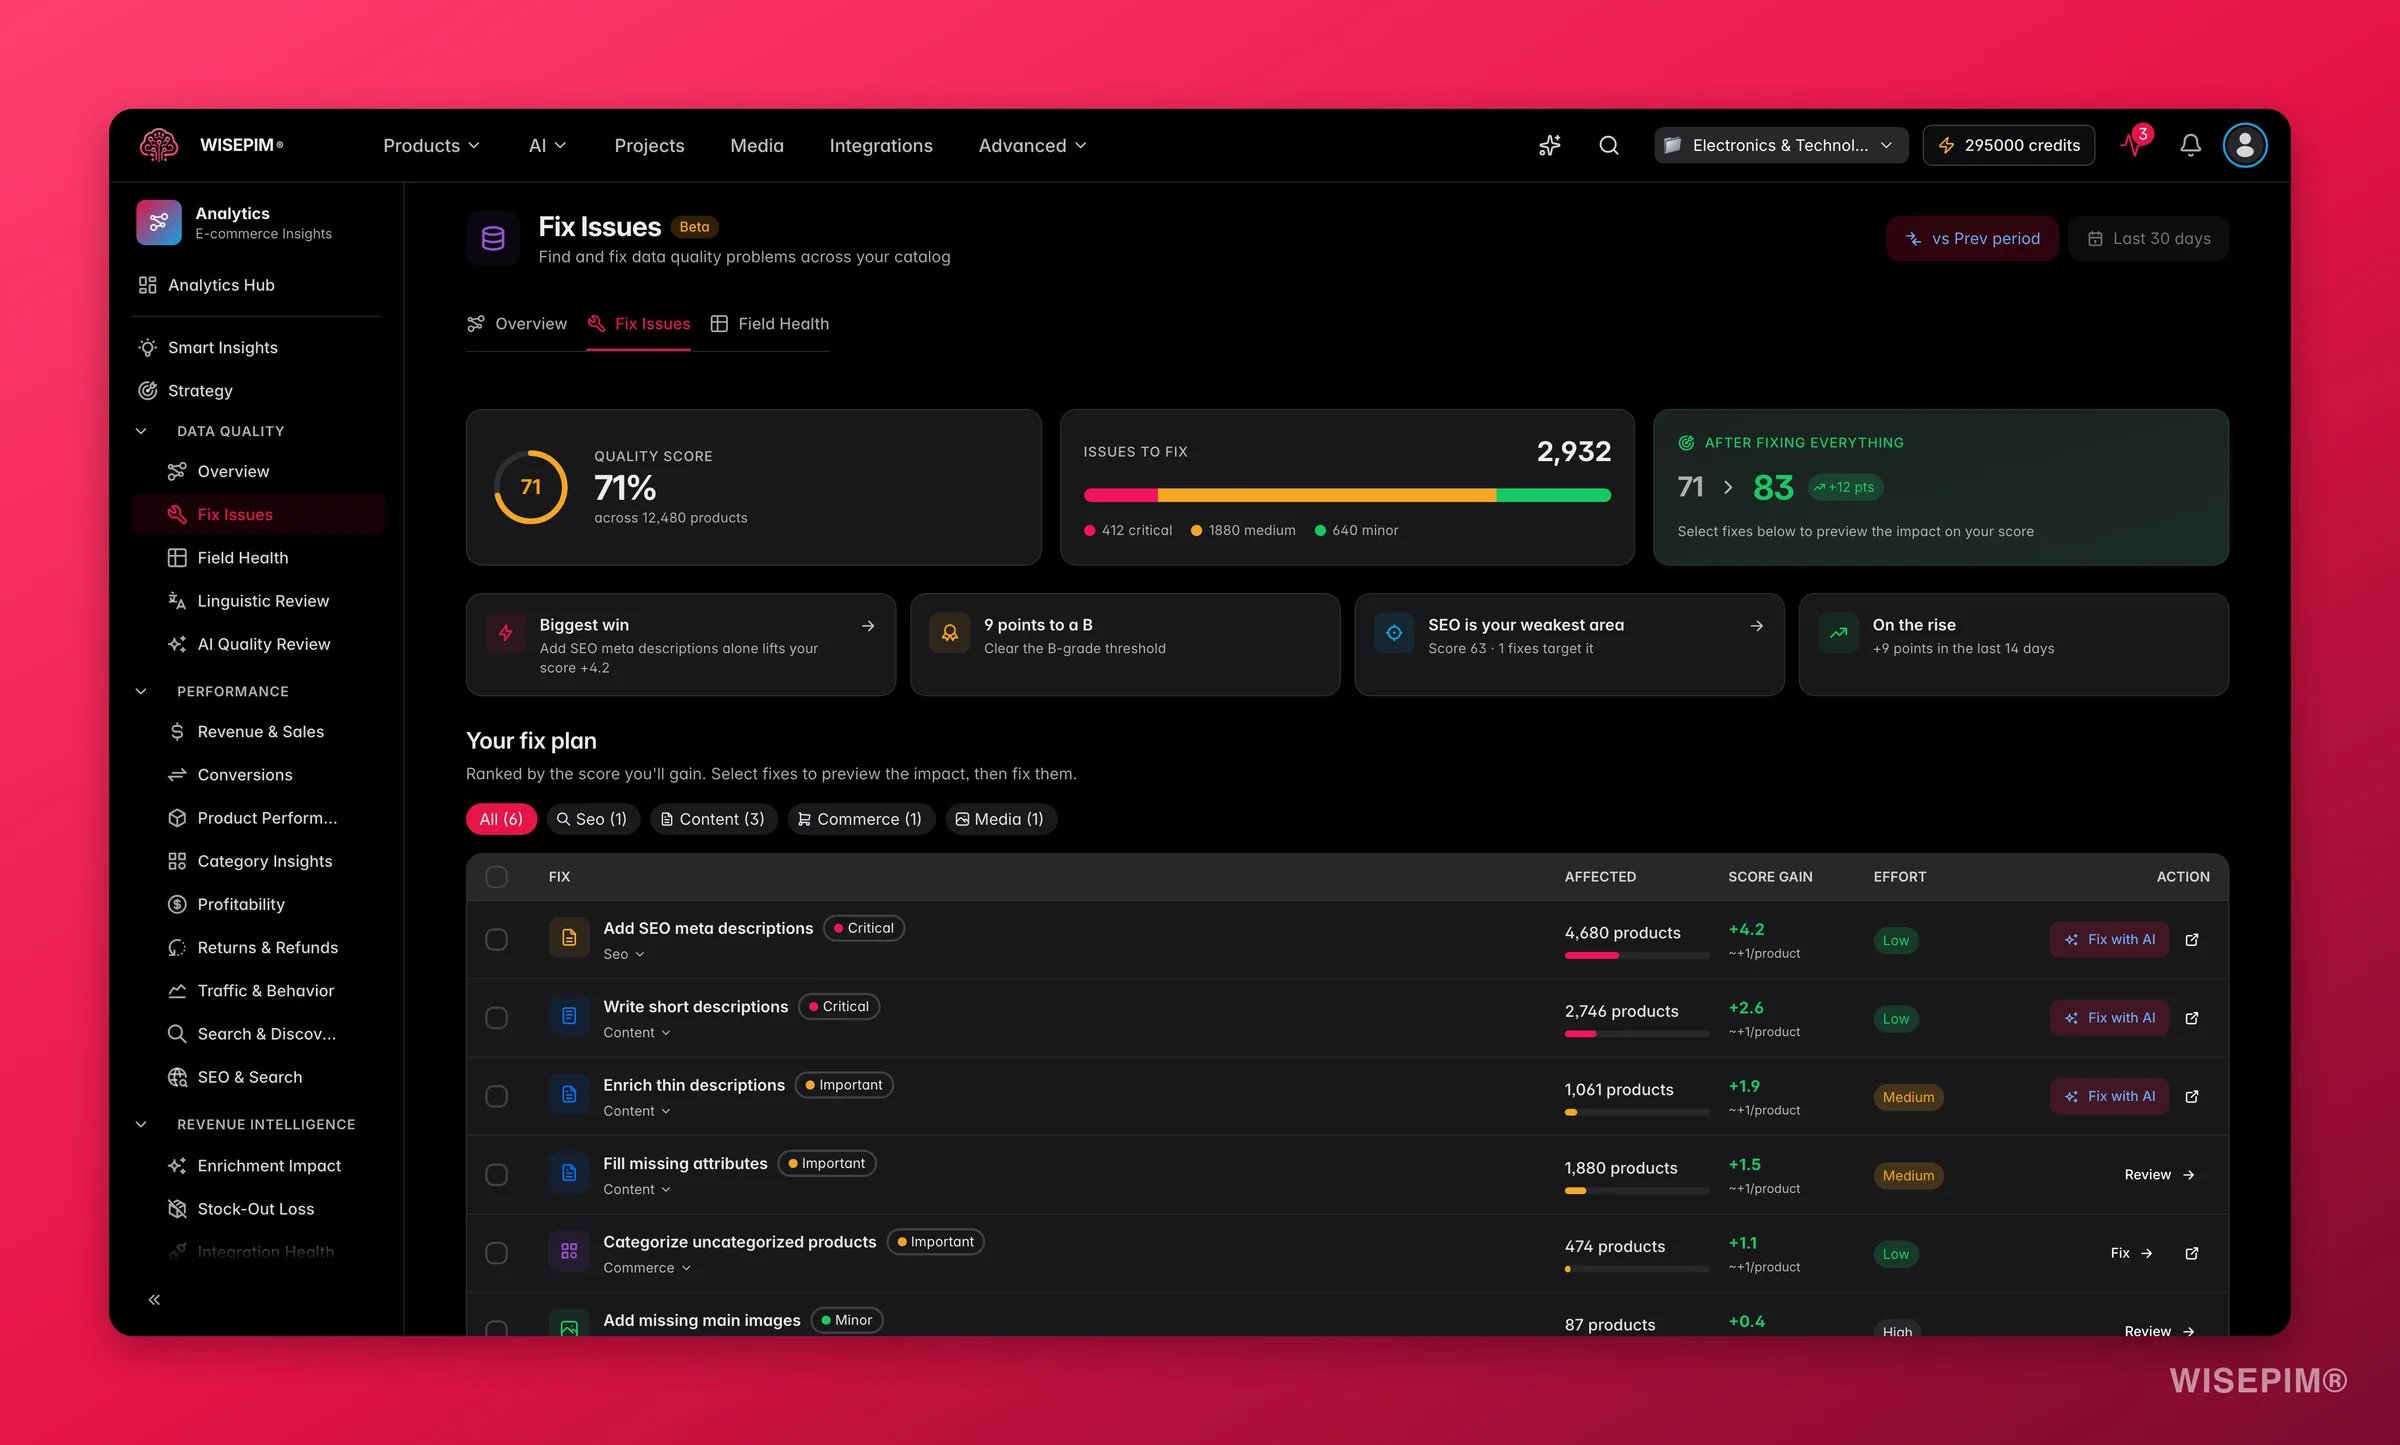 Quick Wins are the highest-impact, lowest-effort improvements available right now. Each suggestion shows:
* **Impact level**: high, medium, or low, plus an **effort estimate**
* **Number of products affected**
* **Potential score increase** from completing the fix (measured by simulating the change)
* A **Fix Products** button that takes you straight to the relevant filtered product list
Start with high-impact, low-effort quick wins. Adding missing product images and generating meta descriptions are typically the fastest score gains.
### Preview before you fix
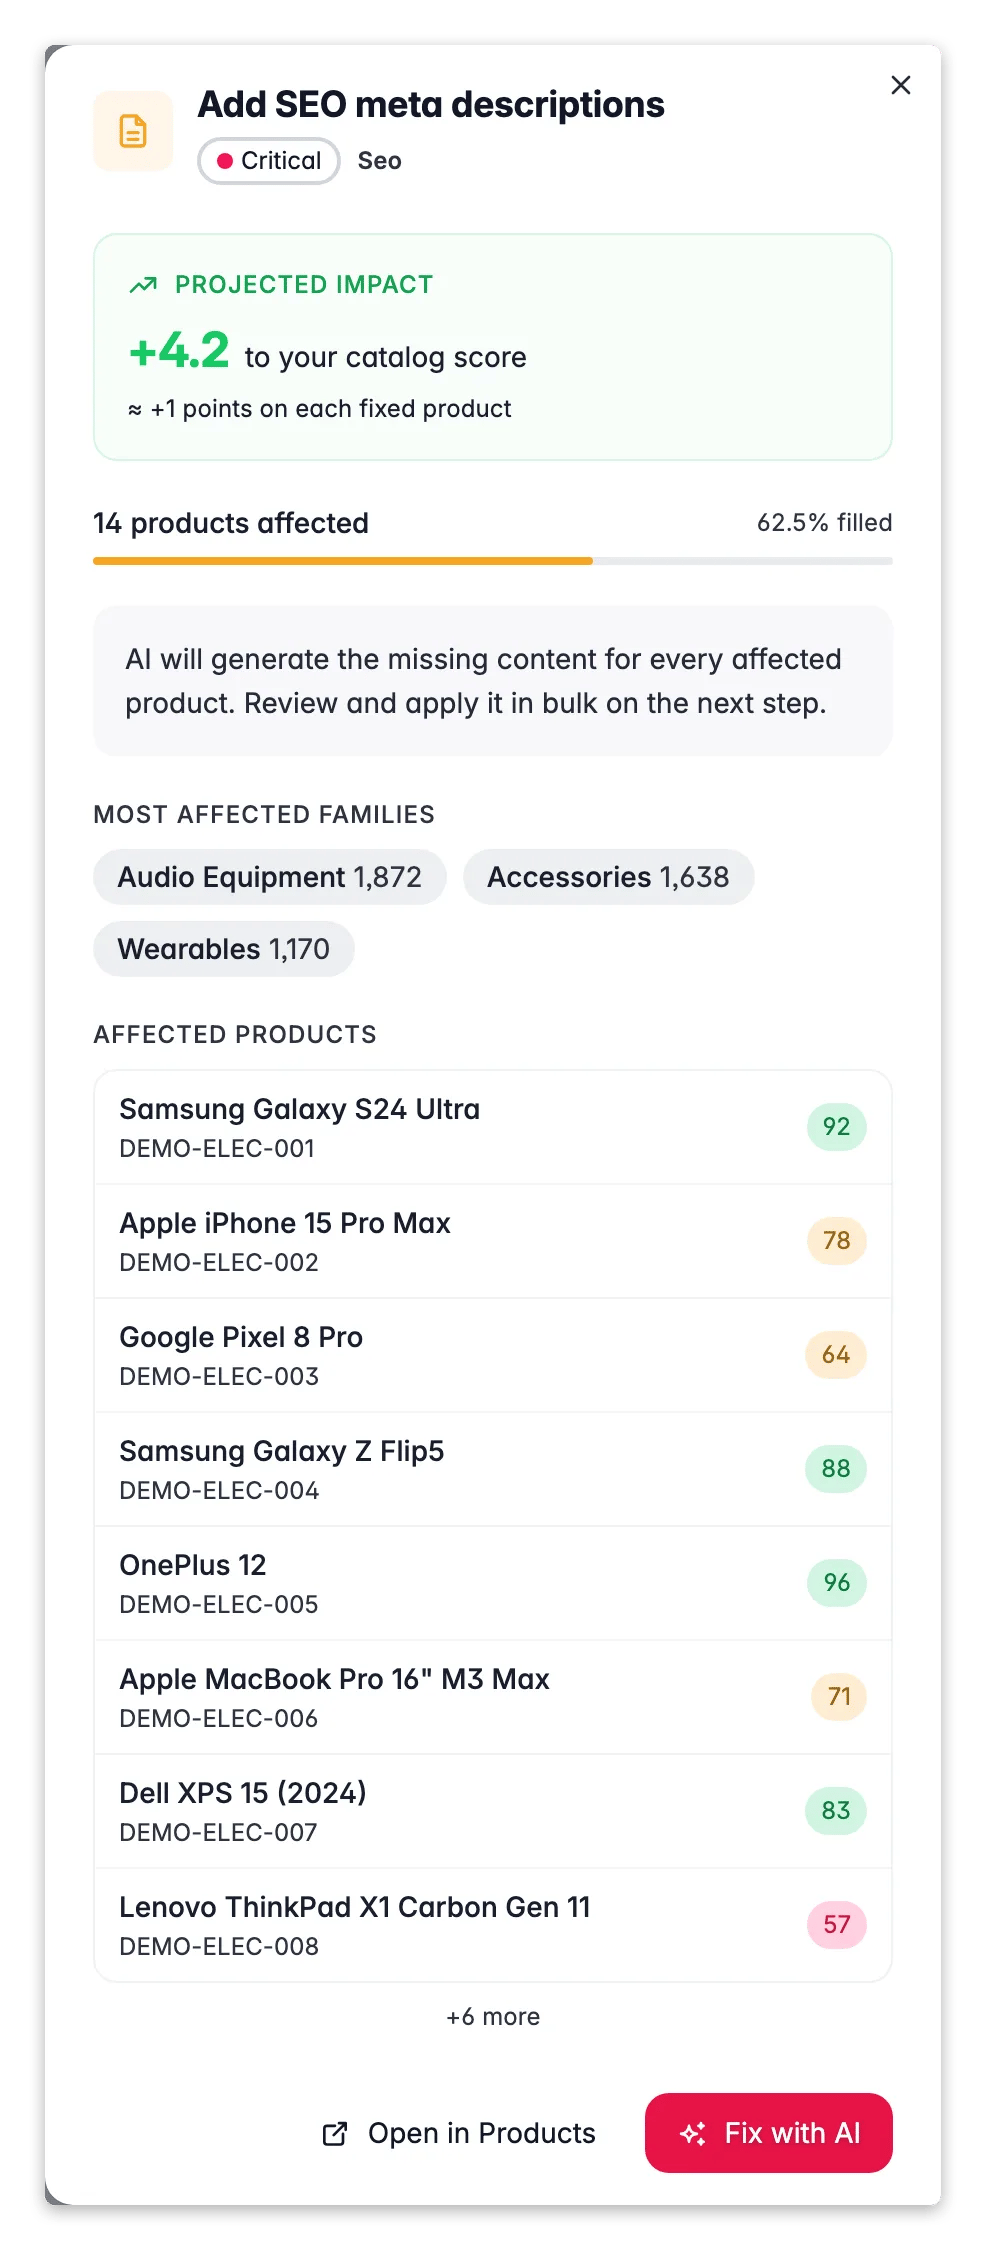
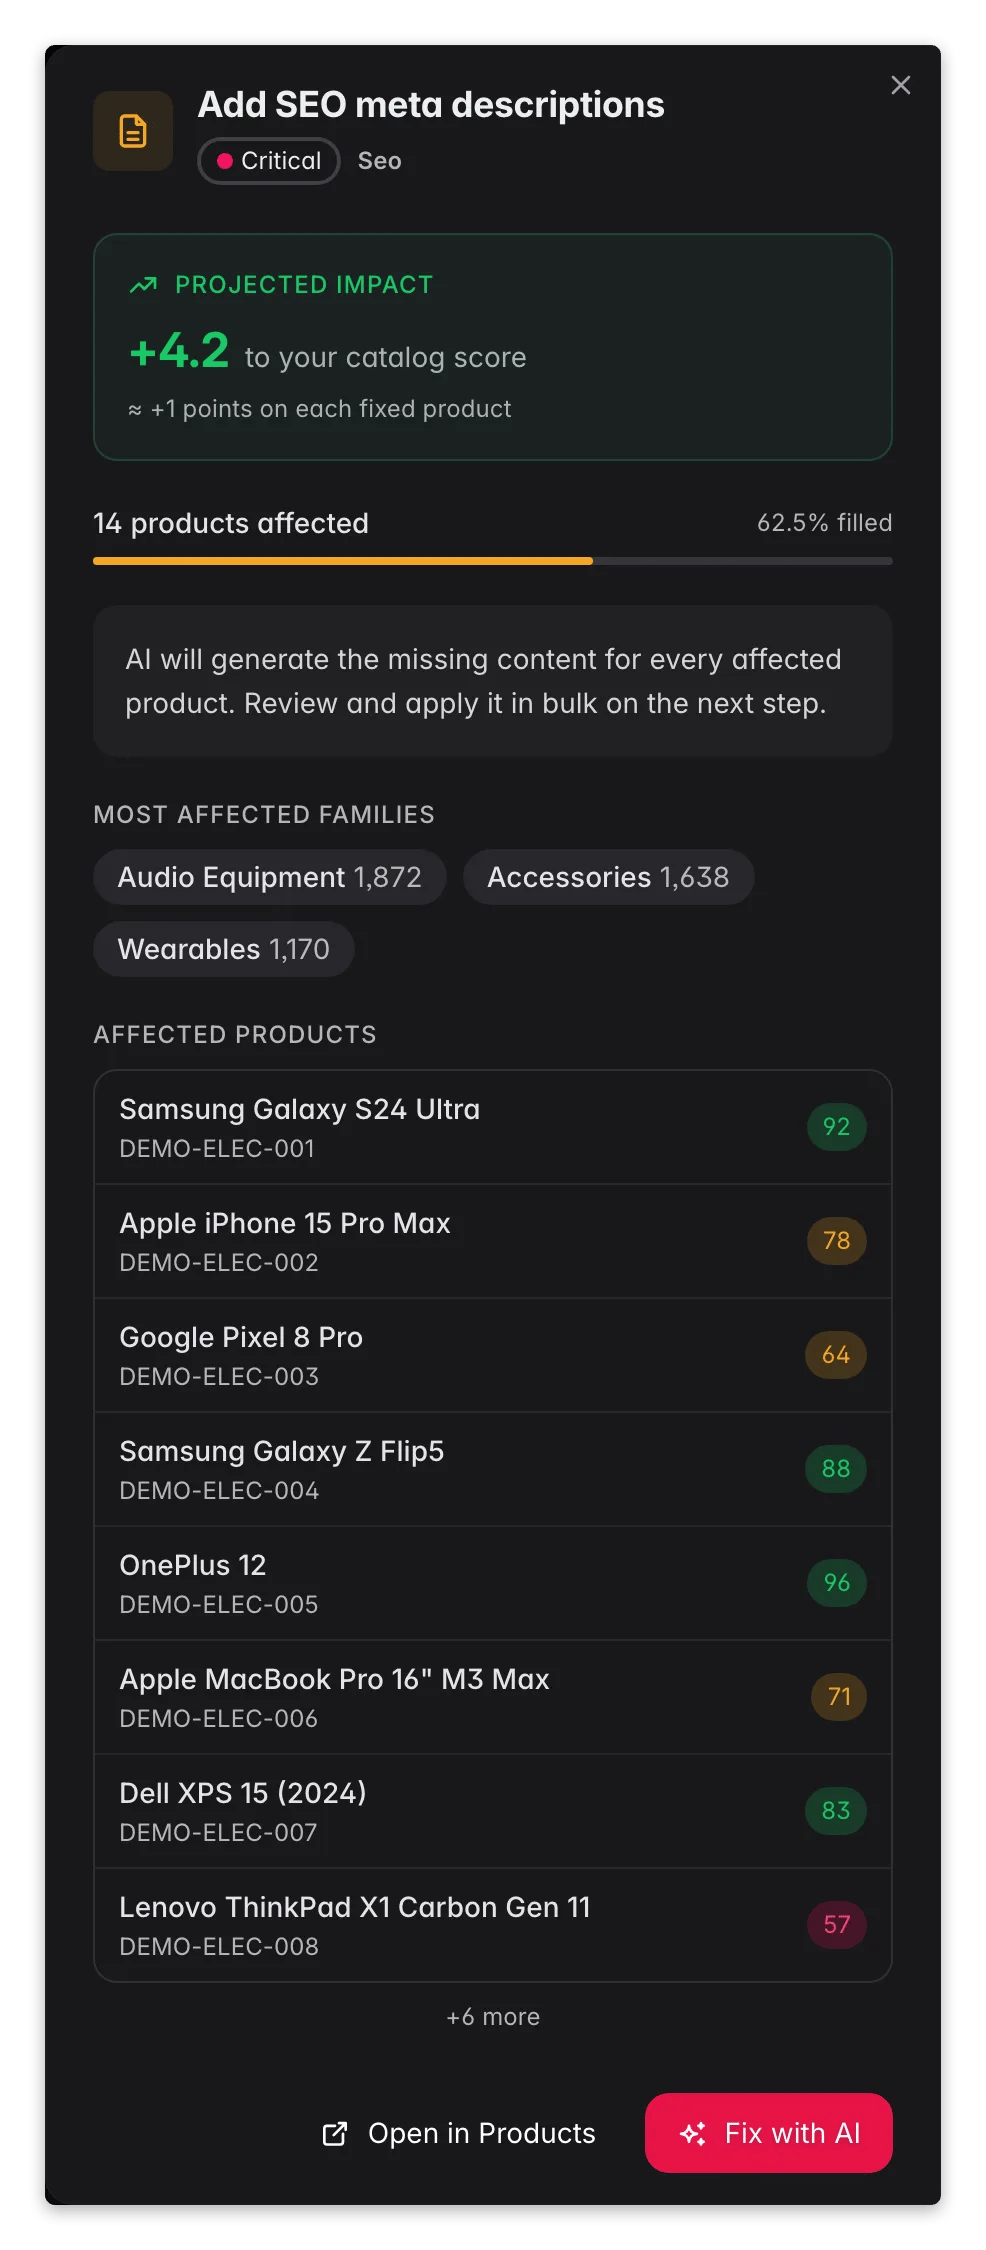
Select a quick win to open its detail drawer. It shows the exact products affected and the score lift you can expect, so you can confirm the fix is worth it before handing off to enrichment or a bulk edit.
Quick Wins are the highest-impact, lowest-effort improvements available right now. Each suggestion shows:
* **Impact level**: high, medium, or low, plus an **effort estimate**
* **Number of products affected**
* **Potential score increase** from completing the fix (measured by simulating the change)
* A **Fix Products** button that takes you straight to the relevant filtered product list
Start with high-impact, low-effort quick wins. Adding missing product images and generating meta descriptions are typically the fastest score gains.
### Preview before you fix
Select a quick win to open its detail drawer. It shows the exact products affected and the score lift you can expect, so you can confirm the fix is worth it before handing off to enrichment or a bulk edit.
 ### Issues table
A filterable, sortable table of every product with open data quality issues, grouped by severity. Click any product to open it and fix the issue inline.
### Improvement roadmap
Based on your current score, the roadmap lays out a phased sequence of improvements toward your target. It considers your coverage gaps, issue counts, and domain scores to give you a prioritized plan.
## Field Health sub-page
The Field Health tab gives you a field-by-field view of coverage across your [product families](/en/products/product-families).
### Field coverage matrix
See which fields are filled across each product family, which families have the lowest coverage for specific fields, and where to focus for the highest score impact.
### Issues table
A filterable, sortable table of every product with open data quality issues, grouped by severity. Click any product to open it and fix the issue inline.
### Improvement roadmap
Based on your current score, the roadmap lays out a phased sequence of improvements toward your target. It considers your coverage gaps, issue counts, and domain scores to give you a prioritized plan.
## Field Health sub-page
The Field Health tab gives you a field-by-field view of coverage across your [product families](/en/products/product-families).
### Field coverage matrix
See which fields are filled across each product family, which families have the lowest coverage for specific fields, and where to focus for the highest score impact.
 ### SEO & Conversion deep dive
Character-limit compliance for meta titles and descriptions, plus which conversion-driving elements (images, rich descriptions) are present across your catalog.
### Channel Readiness matrix
Which of your active sales channels your products are ready for, and which missing fields block a successful listing on each platform.
### Duplicates, freshness, and schema suggestions
* **Duplicates**: products that appear to be duplicates based on content similarity.
* **Catalog freshness**: products that have never been enriched, never been reviewed, or have not been updated in over 30 or 90 days.
* **Schema suggestions**: attributes spotted in supplier feeds or on competitor pages that you have not added to your data model yet.
## Tracking progress
### Progress milestones
Visual milestones mark your journey from your starting score toward your target. Each threshold you cross unlocks the next milestone.
### Improvement activity calendar
A calendar heatmap shows your daily improvement activity. Days with more changes appear in darker shades.
### Issue resolution velocity
How quickly your team resolves quality issues over time. Use this to forecast when you will reach your target score.
### Achievements
Earn achievements as you hit data quality milestones.
## Family score comparison
If you organize products into families (for example, "Electronics" or "Clothing"), the Family Score Comparison lets you compare average quality and completeness scores across families to see which categories need the most attention.
## Benchmarking
See how your catalog quality compares to others in your industry category, including your percentile ranking and distance from the category average.
## Customizing quality scoring
Adjust how scores are calculated in your [project settings](/en/settings/data-quality):
* **Domain weights**: control how much each domain contributes to the overall score.
* **Grade thresholds**: define the score ranges for each letter grade.
* **Core field weights**: specify which fields matter most for completeness scoring.
* **Enabled platforms**: choose which sales channels count for channel readiness.
* **SEO character limits**: set your preferred character ranges for meta titles and descriptions.
## Act on what you find
Check the **Action Impact** chart on the Overview tab first. A sharp drop almost always traces to a bulk import, a batch delete, or an automated update that introduced empty or invalid values. Identify the event, fix the affected products in bulk, and watch the score recover. Outcome: understanding the root cause prevents the same drop from recurring.
Go to the **Fix Issues** tab and sort Quick Wins by impact. Fill the most common missing fields (descriptions, images, categories) with a targeted enrichment run via [Enriching Products](/en/essentials/enriching-products). For channel-specific missing fields, use the Channel Readiness matrix in Field Health to see exactly which fields each platform requires. Outcome: eliminating import rejections and channel listing failures, which translates to products becoming visible on channels they were previously excluded from.
Open the Field Health tab and check the SEO deep dive, it shows character-limit compliance for meta titles and descriptions. Meta titles should be 50–60 characters; meta descriptions 150–160 characters. Products outside these ranges can be batch-enriched via the Fix Products button. Outcome: improving meta content directly improves click-through rates from search results, even without changing rankings.
The funnel shows where the biggest drop-offs are. If 80% of products have a description but only 30% have a meta title, that is your highest-leverage fix, it affects the most products with the least effort per product. Use [Enriching Products](/en/essentials/enriching-products) with bulk generation to close the gap quickly. Outcome: a uniform baseline of content across the catalog, raising the floor score for all products.
Open the improvement roadmap at the bottom of Fix Issues. When quick wins are exhausted, the roadmap surfaces the next phase of work, typically medium-effort fixes like optional attributes, additional images, or cross-channel compliance. Outcome: a phased plan that keeps score momentum going without requiring a manual audit.
Use the Family Score Comparison to identify the outlier, then filter to that family in the issues table to see which specific fields are missing. Consider whether those fields have a standard answer you can apply in bulk, for example, setting a default brand, or adding a category mapping that covers the whole family. Outcome: lifting a low-scoring family to the catalog average often has a larger overall score impact than further optimizing already-strong families.
## Related
Return to the Hub for a birds-eye view of your store and Smart Insights.
Build a personalized dashboard that includes your most important quality metrics.
### SEO & Conversion deep dive
Character-limit compliance for meta titles and descriptions, plus which conversion-driving elements (images, rich descriptions) are present across your catalog.
### Channel Readiness matrix
Which of your active sales channels your products are ready for, and which missing fields block a successful listing on each platform.
### Duplicates, freshness, and schema suggestions
* **Duplicates**: products that appear to be duplicates based on content similarity.
* **Catalog freshness**: products that have never been enriched, never been reviewed, or have not been updated in over 30 or 90 days.
* **Schema suggestions**: attributes spotted in supplier feeds or on competitor pages that you have not added to your data model yet.
## Tracking progress
### Progress milestones
Visual milestones mark your journey from your starting score toward your target. Each threshold you cross unlocks the next milestone.
### Improvement activity calendar
A calendar heatmap shows your daily improvement activity. Days with more changes appear in darker shades.
### Issue resolution velocity
How quickly your team resolves quality issues over time. Use this to forecast when you will reach your target score.
### Achievements
Earn achievements as you hit data quality milestones.
## Family score comparison
If you organize products into families (for example, "Electronics" or "Clothing"), the Family Score Comparison lets you compare average quality and completeness scores across families to see which categories need the most attention.
## Benchmarking
See how your catalog quality compares to others in your industry category, including your percentile ranking and distance from the category average.
## Customizing quality scoring
Adjust how scores are calculated in your [project settings](/en/settings/data-quality):
* **Domain weights**: control how much each domain contributes to the overall score.
* **Grade thresholds**: define the score ranges for each letter grade.
* **Core field weights**: specify which fields matter most for completeness scoring.
* **Enabled platforms**: choose which sales channels count for channel readiness.
* **SEO character limits**: set your preferred character ranges for meta titles and descriptions.
## Act on what you find
Check the **Action Impact** chart on the Overview tab first. A sharp drop almost always traces to a bulk import, a batch delete, or an automated update that introduced empty or invalid values. Identify the event, fix the affected products in bulk, and watch the score recover. Outcome: understanding the root cause prevents the same drop from recurring.
Go to the **Fix Issues** tab and sort Quick Wins by impact. Fill the most common missing fields (descriptions, images, categories) with a targeted enrichment run via [Enriching Products](/en/essentials/enriching-products). For channel-specific missing fields, use the Channel Readiness matrix in Field Health to see exactly which fields each platform requires. Outcome: eliminating import rejections and channel listing failures, which translates to products becoming visible on channels they were previously excluded from.
Open the Field Health tab and check the SEO deep dive, it shows character-limit compliance for meta titles and descriptions. Meta titles should be 50–60 characters; meta descriptions 150–160 characters. Products outside these ranges can be batch-enriched via the Fix Products button. Outcome: improving meta content directly improves click-through rates from search results, even without changing rankings.
The funnel shows where the biggest drop-offs are. If 80% of products have a description but only 30% have a meta title, that is your highest-leverage fix, it affects the most products with the least effort per product. Use [Enriching Products](/en/essentials/enriching-products) with bulk generation to close the gap quickly. Outcome: a uniform baseline of content across the catalog, raising the floor score for all products.
Open the improvement roadmap at the bottom of Fix Issues. When quick wins are exhausted, the roadmap surfaces the next phase of work, typically medium-effort fixes like optional attributes, additional images, or cross-channel compliance. Outcome: a phased plan that keeps score momentum going without requiring a manual audit.
Use the Family Score Comparison to identify the outlier, then filter to that family in the issues table to see which specific fields are missing. Consider whether those fields have a standard answer you can apply in bulk, for example, setting a default brand, or adding a category mapping that covers the whole family. Outcome: lifting a low-scoring family to the catalog average often has a larger overall score impact than further optimizing already-strong families.
## Related
Return to the Hub for a birds-eye view of your store and Smart Insights.
Build a personalized dashboard that includes your most important quality metrics.