> ## Documentation Index
> Fetch the complete documentation index at: https://docs.wisepim.com/llms.txt
> Use this file to discover all available pages before exploring further.
# Channel Analytics
> Compare revenue, orders, and efficiency across Shopify, WooCommerce, Magento, and every connected sales channel in one view.
The Channels report puts your connected sales platforms side by side. Compare Shopify, WooCommerce, Magento, and any other channel you sell on, all in one view. No more checking each platform on its own.
The report's primary payoff is comparative efficiency: it shows not just which channel earns the most, but which earns the most *per order*. That distinction often changes where you invest, a smaller channel with a high AOV can be worth more than a high-volume channel with thin margins.
Channel data comes from your connected e-commerce integrations. Each platform shows as its own channel. Connect more platforms in [Integrations](/en/integrations/supported-platforms) to get the full comparison.
## Metrics at a glance
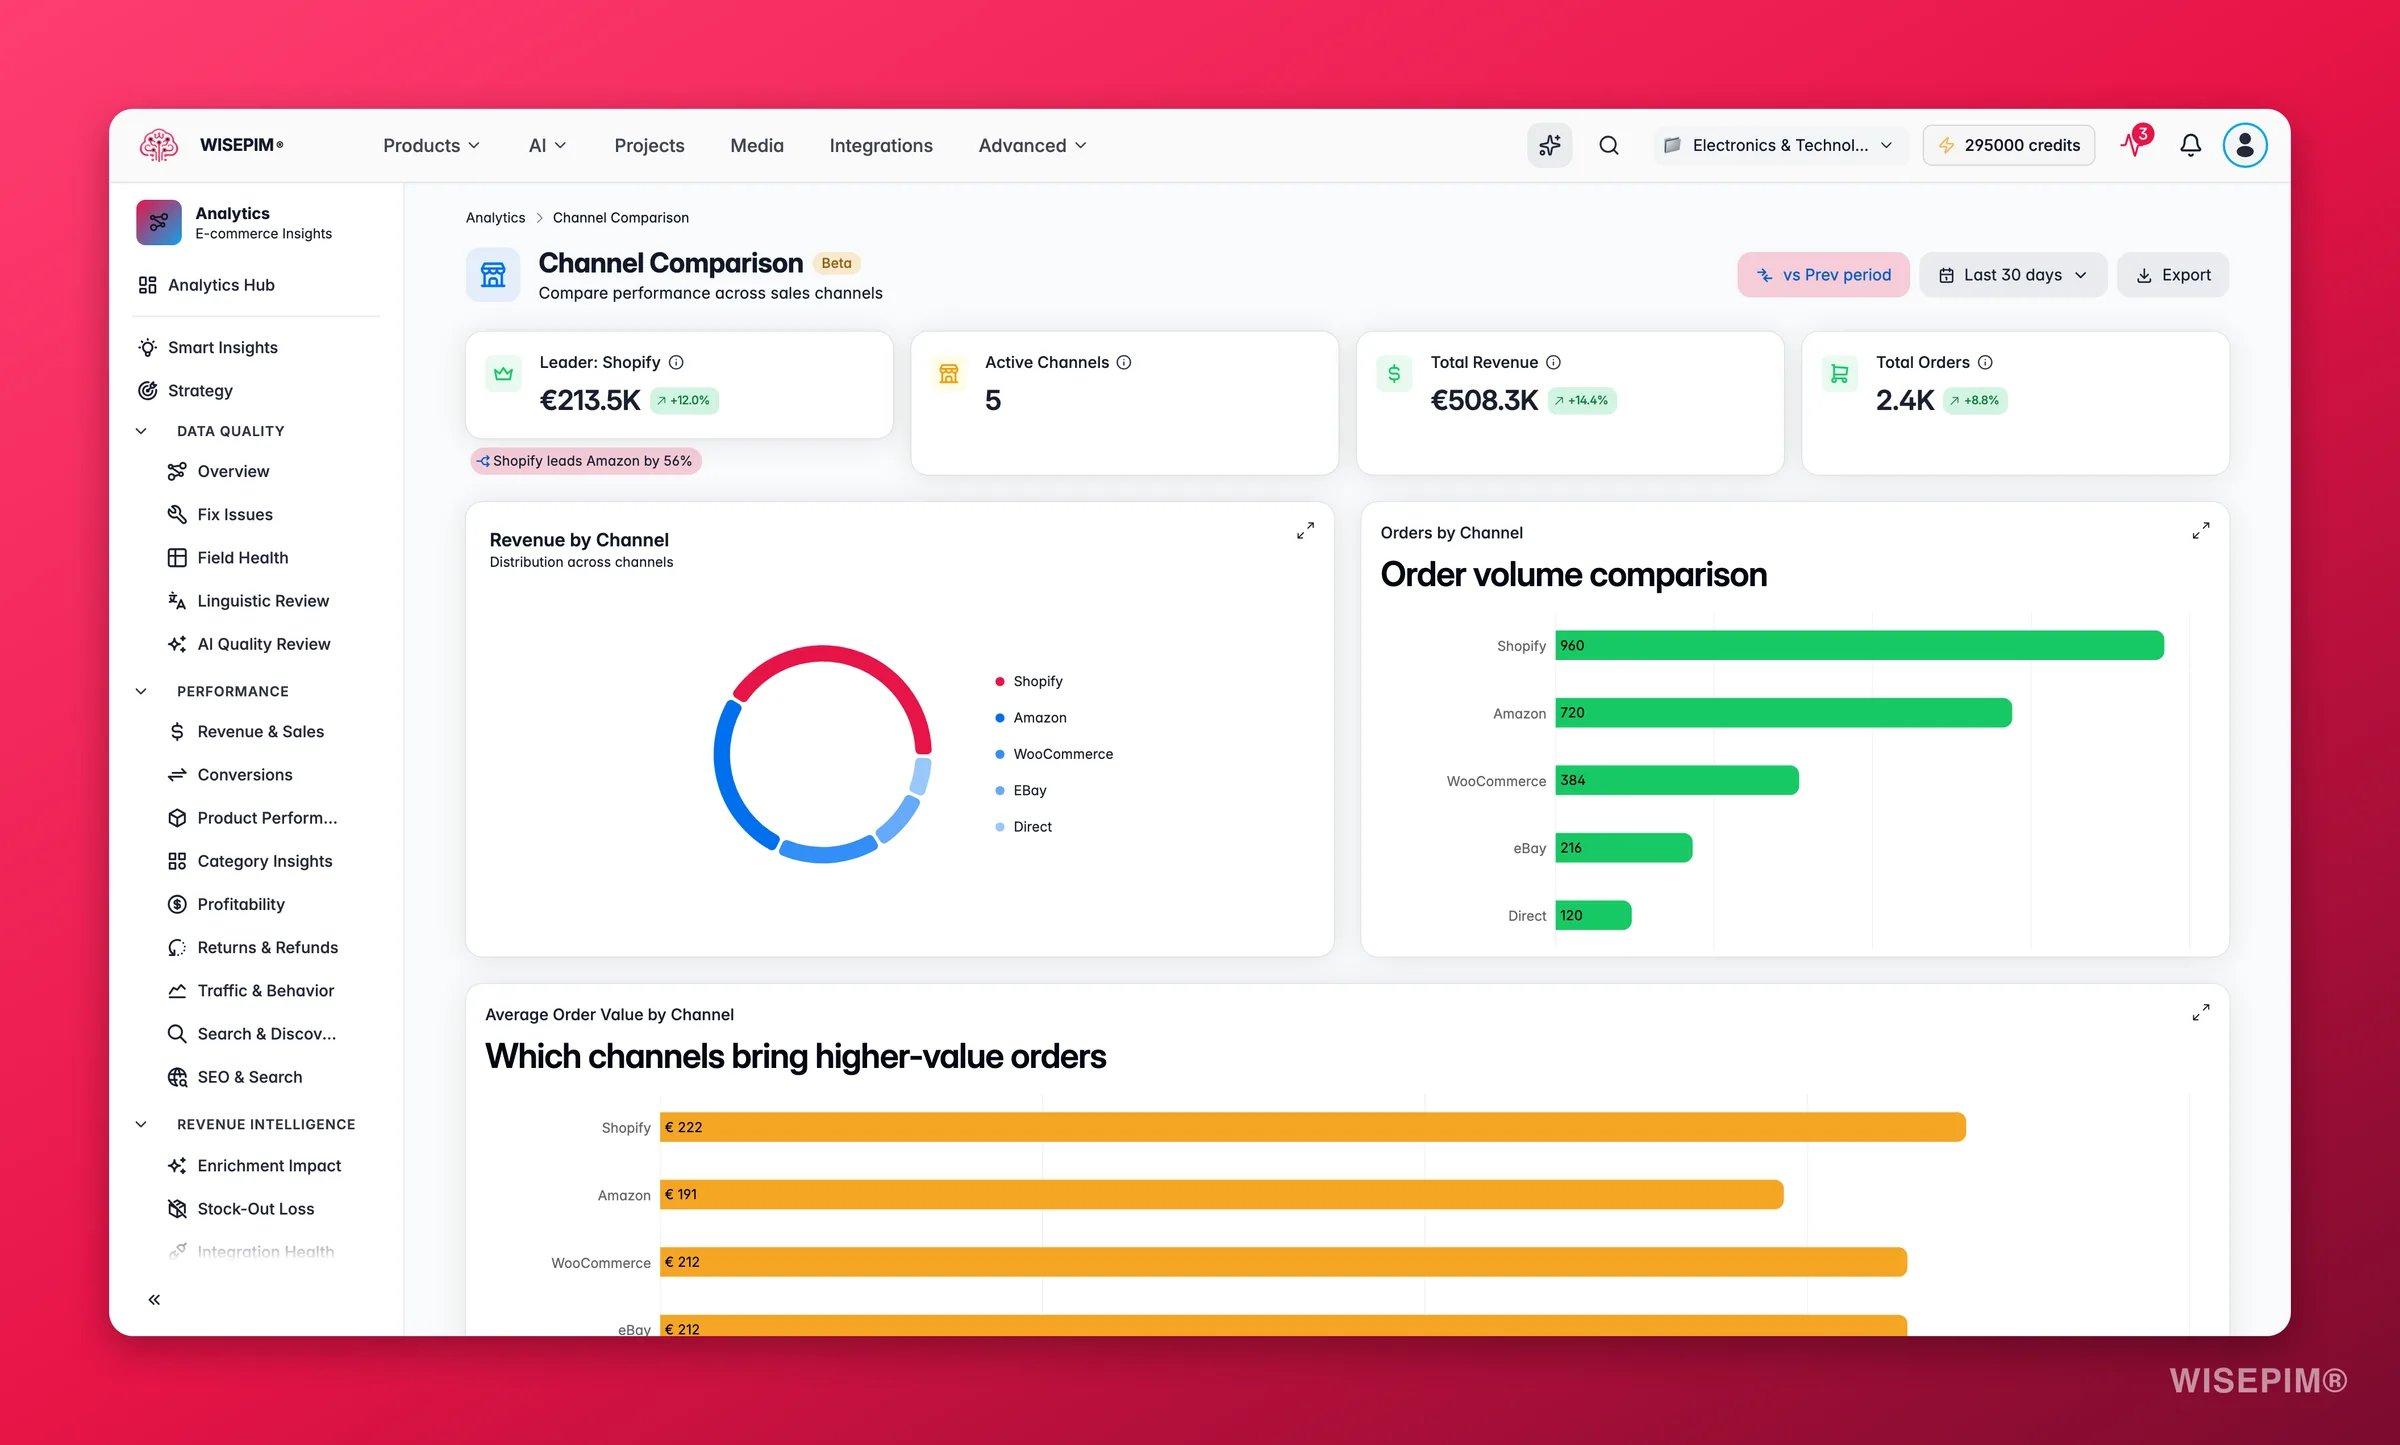
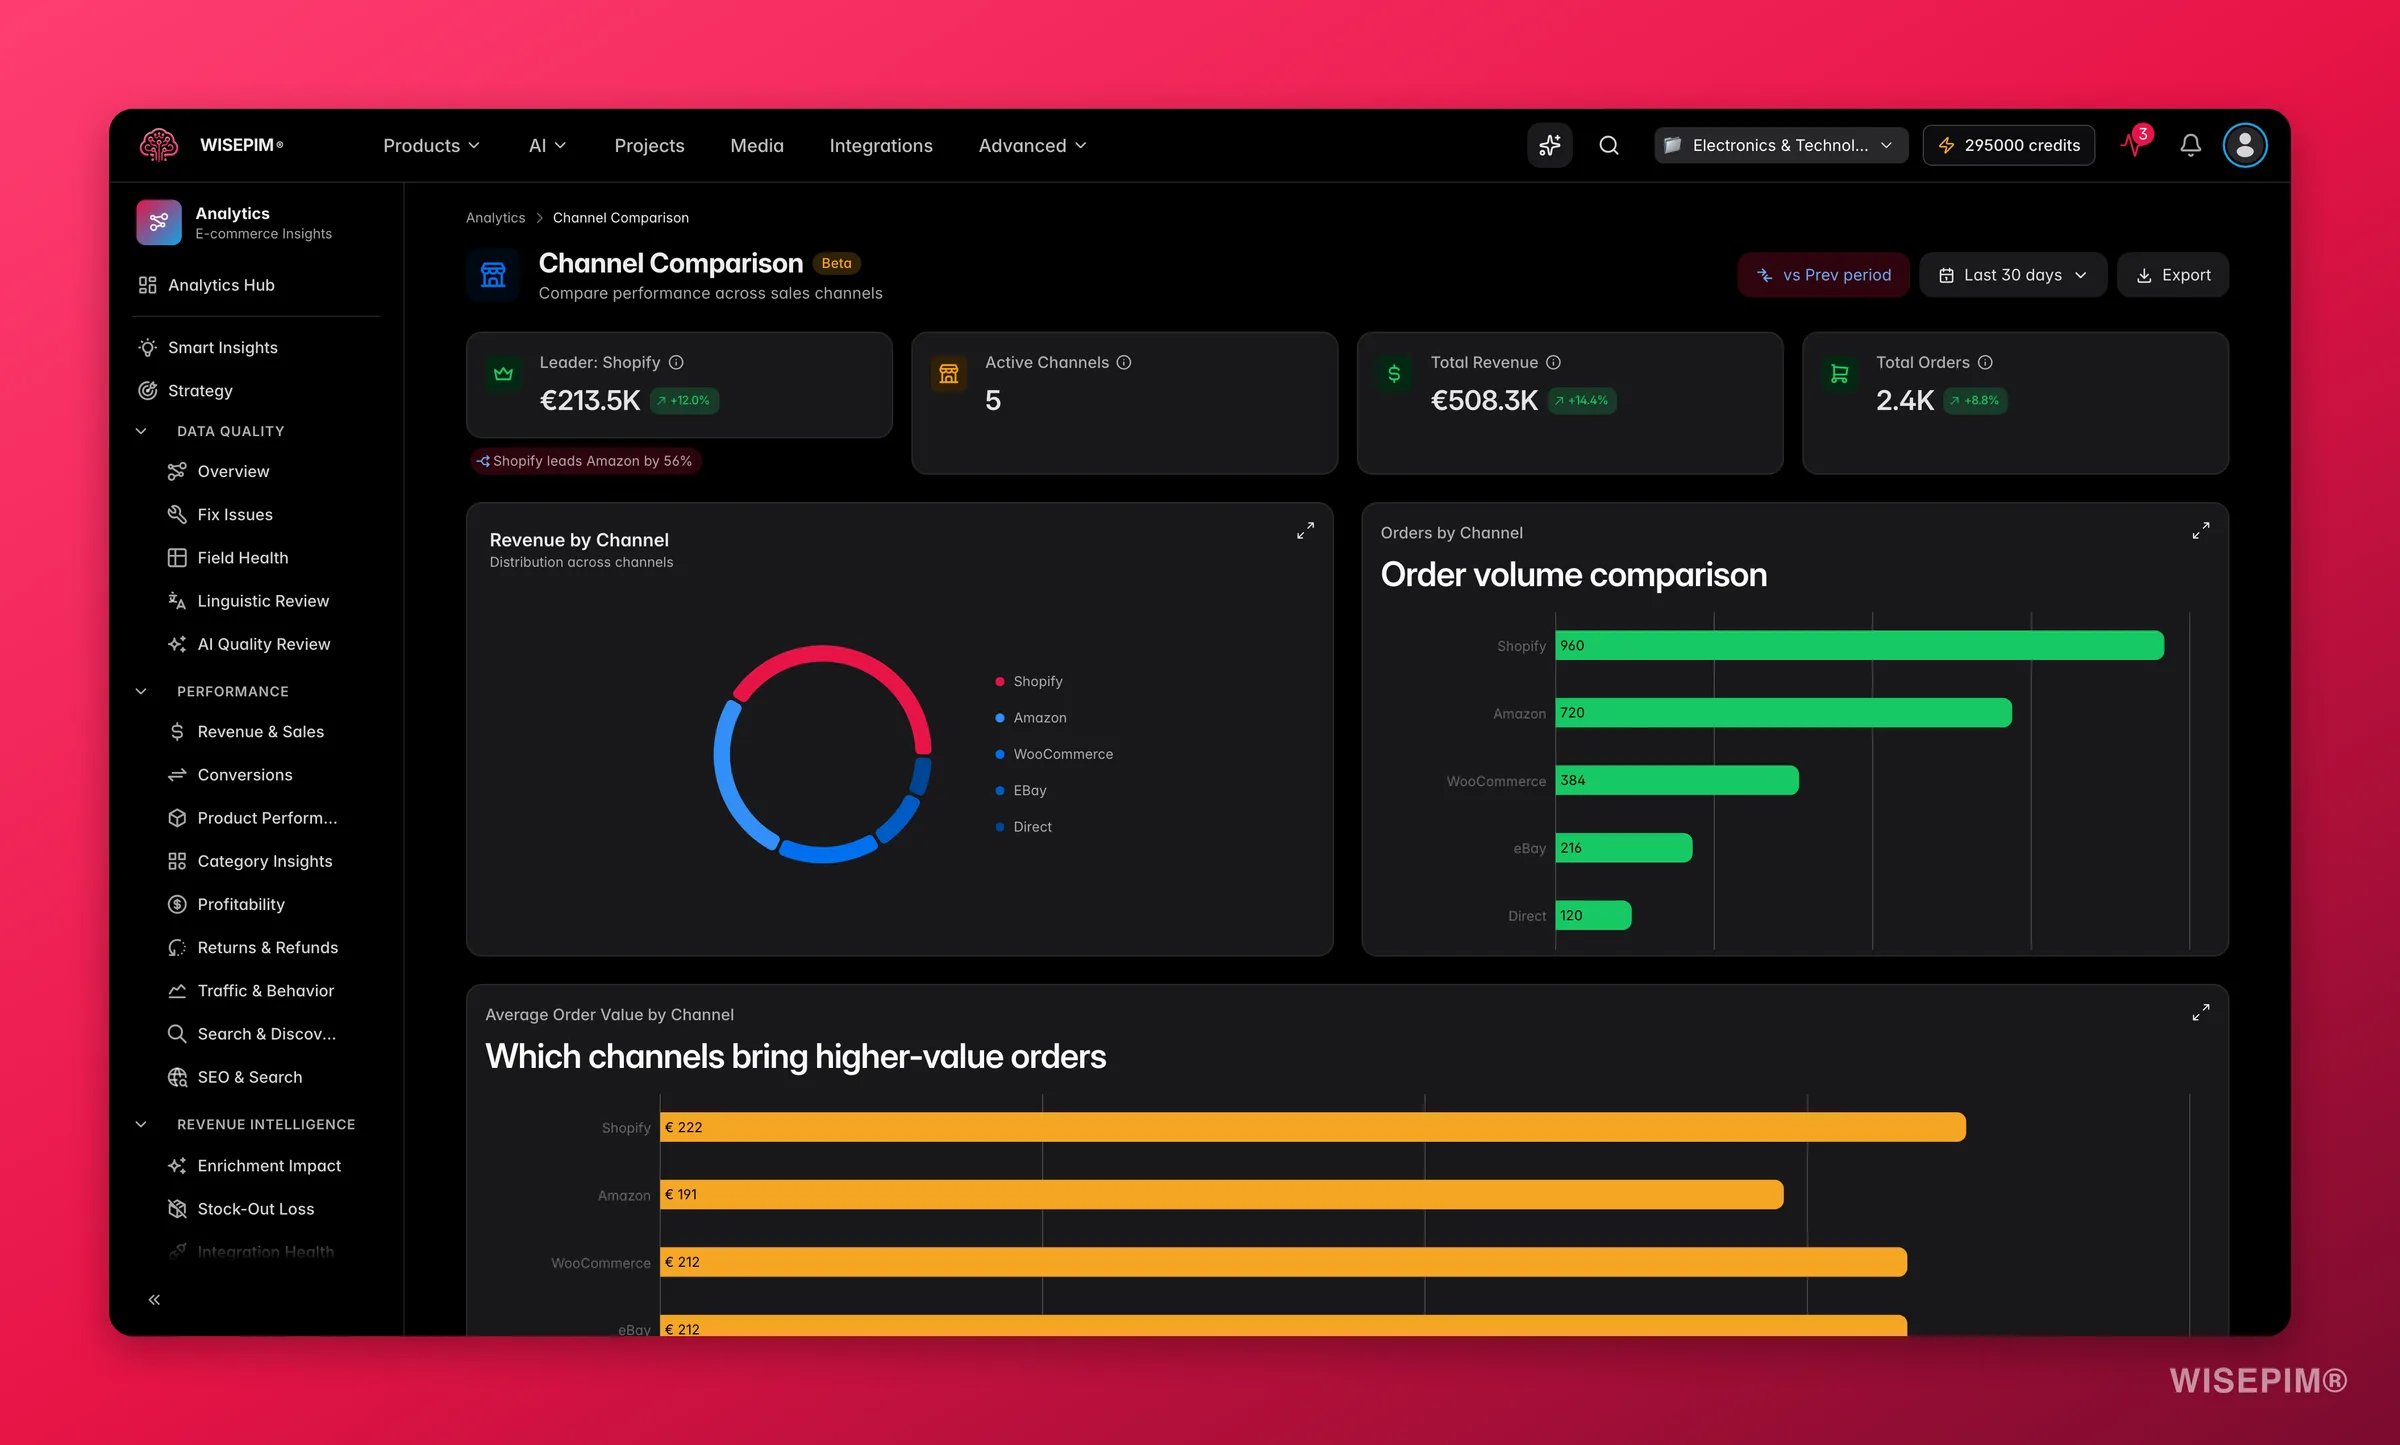 The top of the report shows four numbers for the period you selected:
| Metric | What it tells you |
| ------------------- | --------------------------------------------------- |
| **Primary Channel** | Your highest-revenue channel for the period. |
| **Active Channels** | How many connected channels had at least one order. |
| **Total Revenue** | Combined revenue across all channels. |
| **Total Orders** | Combined order count across all channels. |
Do not compare revenue alone. Compare efficiency too. A channel with lower revenue but higher AOV and conversion can be worth more investment than a high-volume, low-margin one.
## What good looks like
| Metric | Concerning | Acceptable | Healthy |
| ---------------------------- | ----------------------------- | ---------- | ---------- |
| **Top channel share** | Above 70% | 50–70% | Under 50% |
| **AOV gap between channels** | 3× or more difference | 1.5–3× | Under 1.5× |
| **Active channels** | 1 only | 2–3 | 3 or more |
| **Trend indicator** | Declining 2+ periods in a row | Flat | Growing |
These thresholds are directional. A single dominant channel is not inherently bad, many successful stores sell primarily on one platform. The concern is *unplanned* concentration with no fallback.
## Lead insights
Two insight chips appear above the charts whenever there is enough data to generate them:
* **Channel concentration**: the top channel's revenue share as a percentage, flagged with a warning if that share is 50% or higher. A high concentration is not always bad, but it means a disruption on that platform, a policy change, an outage, or a fee increase, has an outsized effect on your total revenue.
* **Lead vs runner-up**: how far ahead the primary channel is from the second-highest channel by revenue, expressed as a euro or percentage gap. A large gap tells you the runner-up has significant room to grow; a small gap means the two channels are genuinely competitive.
Both chips update automatically when you change the date range.
## Read the charts
Three views help you compare channels from different angles.
Shows each channel's share of total revenue. Tells you at a glance how dependent you are on any single platform. When you have more than six active channels, the donut caps at the top six by revenue and groups the rest into an **Other** segment to keep the chart readable.
Compares order volume across channels. Pair it with the revenue donut to spot channels with many orders but low revenue per order, or the reverse.
Compares average order value (AOV) across channels. Big gaps can point to different customers, product mixes, or pricing per platform.
### Channel Performance table
The table lists one row per channel. The **primary channel** (highest revenue for the period) is marked with a badge so it is easy to identify. Every column is sortable, click a header to rank channels by **Revenue**, **Share %**, **Orders**, or **AOV**. Sorting by AOV rather than revenue often surfaces a smaller channel that punches above its weight on order value.
| Column | Meaning |
| ------------------- | ------------------------------------- |
| **Revenue** | Total revenue for the channel. |
| **Orders** | Number of orders. |
| **AOV** | Average order value. |
| **Units Sold** | Total items sold. |
| **Revenue Share %** | The channel's share of total revenue. |
Each row also shows a **trend indicator** for the period's revenue relative to the previous period, so you can see at a glance which channels are growing and which are softening without switching to another view. A consistently declining trend on a previously healthy channel is an early warning, investigate before the channel drops significantly in absolute revenue.
## Act on what you find
Match what you see to the right move.
Heavy dependence on a single platform creates fragility, a fee increase, algorithm change, or outage on that platform directly hits your overall revenue. Start by investing in the content and feed quality of your second-ranked channel. Use [Feed Hub](/en/essentials/feed-hub) to ensure product feeds to secondary channels are complete and up to date. Outcome: even a modest shift of 5–10% of revenue to a second channel meaningfully reduces platform risk.
That channel likely attracts bargain-seeking or lower-value buyers, or its product mix skews toward cheaper items. Check [Category Insights](/en/analytics/category-insights) filtered to that channel's primary categories to see which product types sell there. Consider whether you are surfacing high-value items prominently in that channel's feed, or whether pricing or bundle strategies can lift per-order value. Outcome: a 10% AOV improvement on a high-volume channel has the same revenue impact as a 10% increase in order count.
New channels usually underperform because product content is not optimised for their specific requirements, title lengths, image ratios, required attributes, or category mappings differ per platform. Open [Data Quality](/en/analytics/data-quality) and check completeness for the products assigned to that channel. Each platform has its own feed spec; use [Feed Hub](/en/essentials/feed-hub) to validate and fix compliance. Outcome: fully optimised channel feeds typically see a measurable improvement within one to two indexing cycles on the platform.
A large AOV gap, say, one channel averaging twice another, usually reflects a different customer profile, a different product assortment, or deliberate pricing differences. Check [Customer Insights](/en/analytics/customer-insights) to see if channels that look similar in order count actually differ in LTV. If one channel has high AOV and low order count, it may reward more marketing investment. Outcome: understanding AOV by channel guides where to shift spend for the best return.
Two or more consecutive declining periods on a previously healthy channel is a signal worth investigating before revenue drops further. Go to [Category Insights](/en/analytics/category-insights) and filter to the affected channel's categories to see if specific product types are pulling back. Check whether a recent feed change, price update, or platform policy change coincides with the timing. Outcome: catching a decline early gives you time to act before it compounds.
## Related
See the combined revenue picture across channels and categories.
See which marketing efforts drive sales to each channel.
Compare category performance to see what sells best on each channel.
The top of the report shows four numbers for the period you selected:
| Metric | What it tells you |
| ------------------- | --------------------------------------------------- |
| **Primary Channel** | Your highest-revenue channel for the period. |
| **Active Channels** | How many connected channels had at least one order. |
| **Total Revenue** | Combined revenue across all channels. |
| **Total Orders** | Combined order count across all channels. |
Do not compare revenue alone. Compare efficiency too. A channel with lower revenue but higher AOV and conversion can be worth more investment than a high-volume, low-margin one.
## What good looks like
| Metric | Concerning | Acceptable | Healthy |
| ---------------------------- | ----------------------------- | ---------- | ---------- |
| **Top channel share** | Above 70% | 50–70% | Under 50% |
| **AOV gap between channels** | 3× or more difference | 1.5–3× | Under 1.5× |
| **Active channels** | 1 only | 2–3 | 3 or more |
| **Trend indicator** | Declining 2+ periods in a row | Flat | Growing |
These thresholds are directional. A single dominant channel is not inherently bad, many successful stores sell primarily on one platform. The concern is *unplanned* concentration with no fallback.
## Lead insights
Two insight chips appear above the charts whenever there is enough data to generate them:
* **Channel concentration**: the top channel's revenue share as a percentage, flagged with a warning if that share is 50% or higher. A high concentration is not always bad, but it means a disruption on that platform, a policy change, an outage, or a fee increase, has an outsized effect on your total revenue.
* **Lead vs runner-up**: how far ahead the primary channel is from the second-highest channel by revenue, expressed as a euro or percentage gap. A large gap tells you the runner-up has significant room to grow; a small gap means the two channels are genuinely competitive.
Both chips update automatically when you change the date range.
## Read the charts
Three views help you compare channels from different angles.
Shows each channel's share of total revenue. Tells you at a glance how dependent you are on any single platform. When you have more than six active channels, the donut caps at the top six by revenue and groups the rest into an **Other** segment to keep the chart readable.
Compares order volume across channels. Pair it with the revenue donut to spot channels with many orders but low revenue per order, or the reverse.
Compares average order value (AOV) across channels. Big gaps can point to different customers, product mixes, or pricing per platform.
### Channel Performance table
The table lists one row per channel. The **primary channel** (highest revenue for the period) is marked with a badge so it is easy to identify. Every column is sortable, click a header to rank channels by **Revenue**, **Share %**, **Orders**, or **AOV**. Sorting by AOV rather than revenue often surfaces a smaller channel that punches above its weight on order value.
| Column | Meaning |
| ------------------- | ------------------------------------- |
| **Revenue** | Total revenue for the channel. |
| **Orders** | Number of orders. |
| **AOV** | Average order value. |
| **Units Sold** | Total items sold. |
| **Revenue Share %** | The channel's share of total revenue. |
Each row also shows a **trend indicator** for the period's revenue relative to the previous period, so you can see at a glance which channels are growing and which are softening without switching to another view. A consistently declining trend on a previously healthy channel is an early warning, investigate before the channel drops significantly in absolute revenue.
## Act on what you find
Match what you see to the right move.
Heavy dependence on a single platform creates fragility, a fee increase, algorithm change, or outage on that platform directly hits your overall revenue. Start by investing in the content and feed quality of your second-ranked channel. Use [Feed Hub](/en/essentials/feed-hub) to ensure product feeds to secondary channels are complete and up to date. Outcome: even a modest shift of 5–10% of revenue to a second channel meaningfully reduces platform risk.
That channel likely attracts bargain-seeking or lower-value buyers, or its product mix skews toward cheaper items. Check [Category Insights](/en/analytics/category-insights) filtered to that channel's primary categories to see which product types sell there. Consider whether you are surfacing high-value items prominently in that channel's feed, or whether pricing or bundle strategies can lift per-order value. Outcome: a 10% AOV improvement on a high-volume channel has the same revenue impact as a 10% increase in order count.
New channels usually underperform because product content is not optimised for their specific requirements, title lengths, image ratios, required attributes, or category mappings differ per platform. Open [Data Quality](/en/analytics/data-quality) and check completeness for the products assigned to that channel. Each platform has its own feed spec; use [Feed Hub](/en/essentials/feed-hub) to validate and fix compliance. Outcome: fully optimised channel feeds typically see a measurable improvement within one to two indexing cycles on the platform.
A large AOV gap, say, one channel averaging twice another, usually reflects a different customer profile, a different product assortment, or deliberate pricing differences. Check [Customer Insights](/en/analytics/customer-insights) to see if channels that look similar in order count actually differ in LTV. If one channel has high AOV and low order count, it may reward more marketing investment. Outcome: understanding AOV by channel guides where to shift spend for the best return.
Two or more consecutive declining periods on a previously healthy channel is a signal worth investigating before revenue drops further. Go to [Category Insights](/en/analytics/category-insights) and filter to the affected channel's categories to see if specific product types are pulling back. Check whether a recent feed change, price update, or platform policy change coincides with the timing. Outcome: catching a decline early gives you time to act before it compounds.
## Related
See the combined revenue picture across channels and categories.
See which marketing efforts drive sales to each channel.
Compare category performance to see what sells best on each channel.